Free printable worksheet · Science
Free carbon emissions by country chart worksheet with answer key
How much carbon dioxide does each country emit per person? A one-page worksheet on a chart of trustworthy public data, with three questions and lines to write on, plus an answer key for you. Free, no account needed, and the numbers are the newest the source has published.
The chart on the worksheet
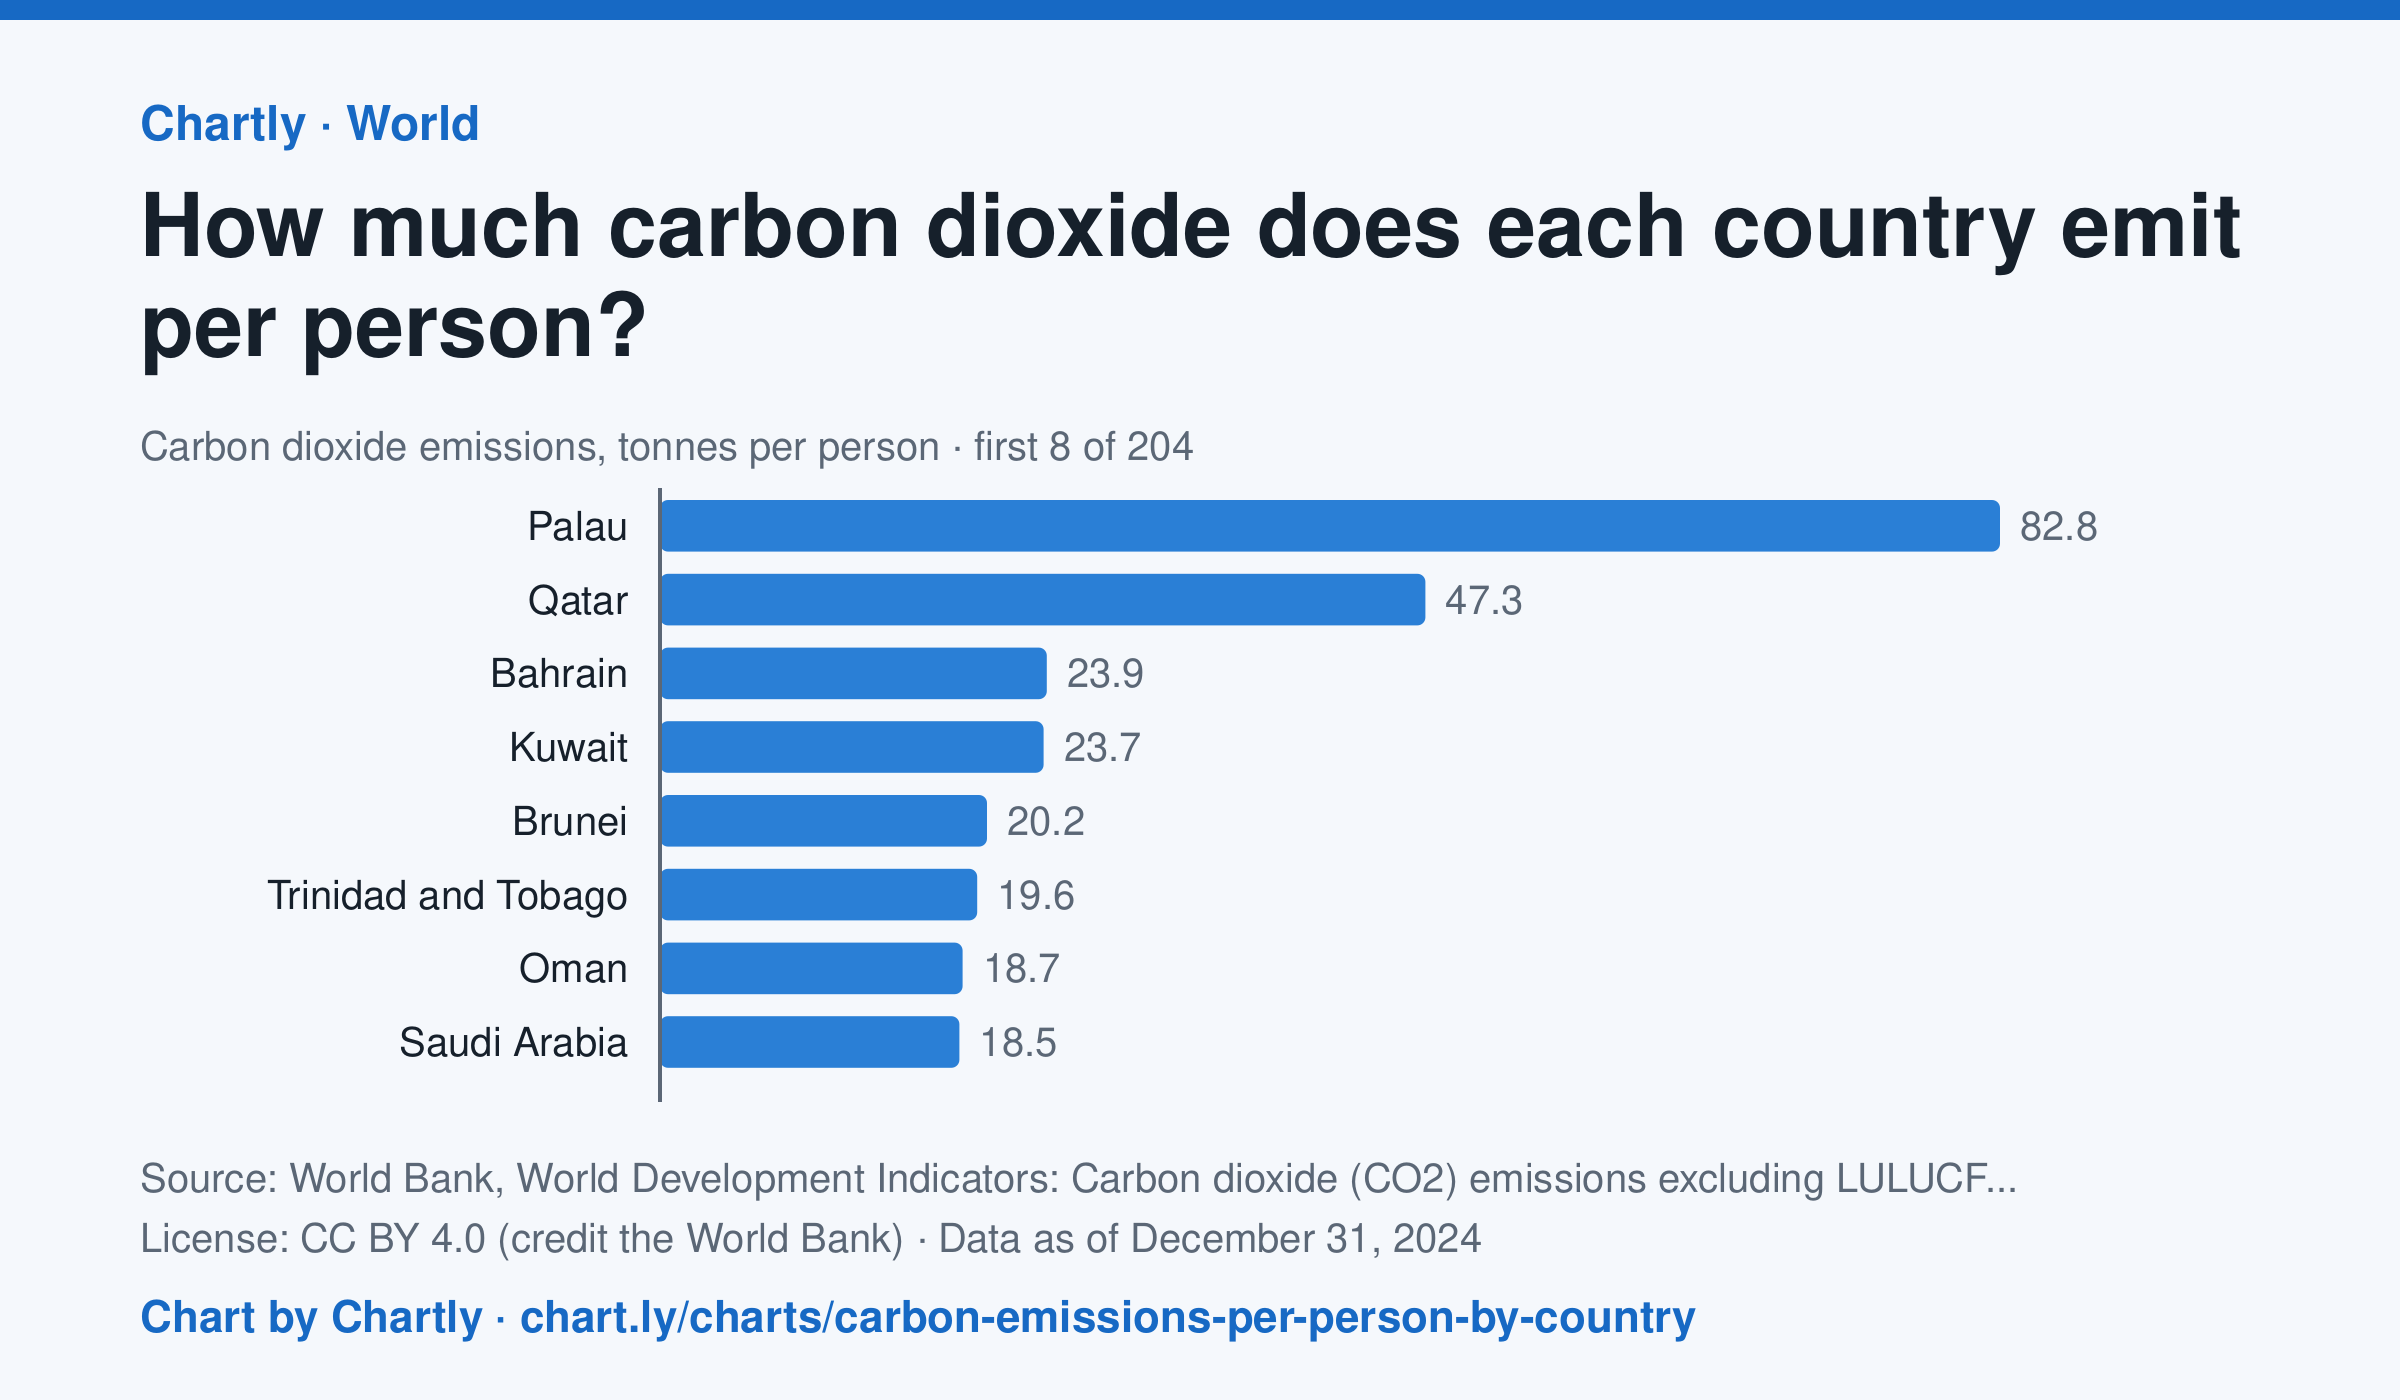
In 2024, people in the United States emitted 13.6 tonnes of carbon dioxide each, in China 9.3 and in India 2.2, against 4.7 worldwide. The highest figure was 82.8 tonnes in Palau, then Qatar (47.3) and Bahrain (23.9). Search 203 countries and territories. The figures count carbon dioxide from burning fuel, industry and other sources, but not from changes in land use such as cutting forests; in a small country, a few power plants, refineries or fuel sales spread over few people can make the figure very high.
Source: World Bank, World Development Indicators: Carbon dioxide (CO2) emissions excluding LULUCF per capita (t CO2e/capita) (CC BY 4.0 (credit the World Bank)) · Data as of Dec 31, 2024 · Open the interactive chart and its numbers
What students answer
How to read this chart
Each bar is the carbon dioxide a country put into the air in a year, divided by its population, in tonnes per person. The dashed line is the world. A country can emit a lot in total but little per person if it has many people, and a tiny country with a refinery or power plant can top the list.
Questions to discuss
- Compare the United States, China and India. Which emits the most per person, and is that the one that emits the most in total?
- Why might some small countries have the highest figures on the chart?
- Which seems fairer for comparing countries' share of the blame for climate change, total emissions or emissions per person? Why?
The answer key gives the chart's key numbers (newest, highest, lowest, biggest change) and, for each question, the figures it asks about, written from the same data students see.
Or assign it online
Post this link in Google Classroom, Canvas or Moodle. Students see the interactive chart and the questions; they don't need an account.
A chart for class, every Monday
One fresh chart of public data, three questions to discuss and a link that opens it as a class assignment, in your inbox each Monday. Free, no account. See this week's.