Free printable worksheet · Health
Free teen birth rate chart worksheet with answer key
How has the US teen birth rate changed since 1940? A one-page worksheet on a chart of trustworthy public data, with three questions and lines to write on, plus an answer key for you. Free, no account needed, and the numbers are the newest the source has published.
The chart on the worksheet
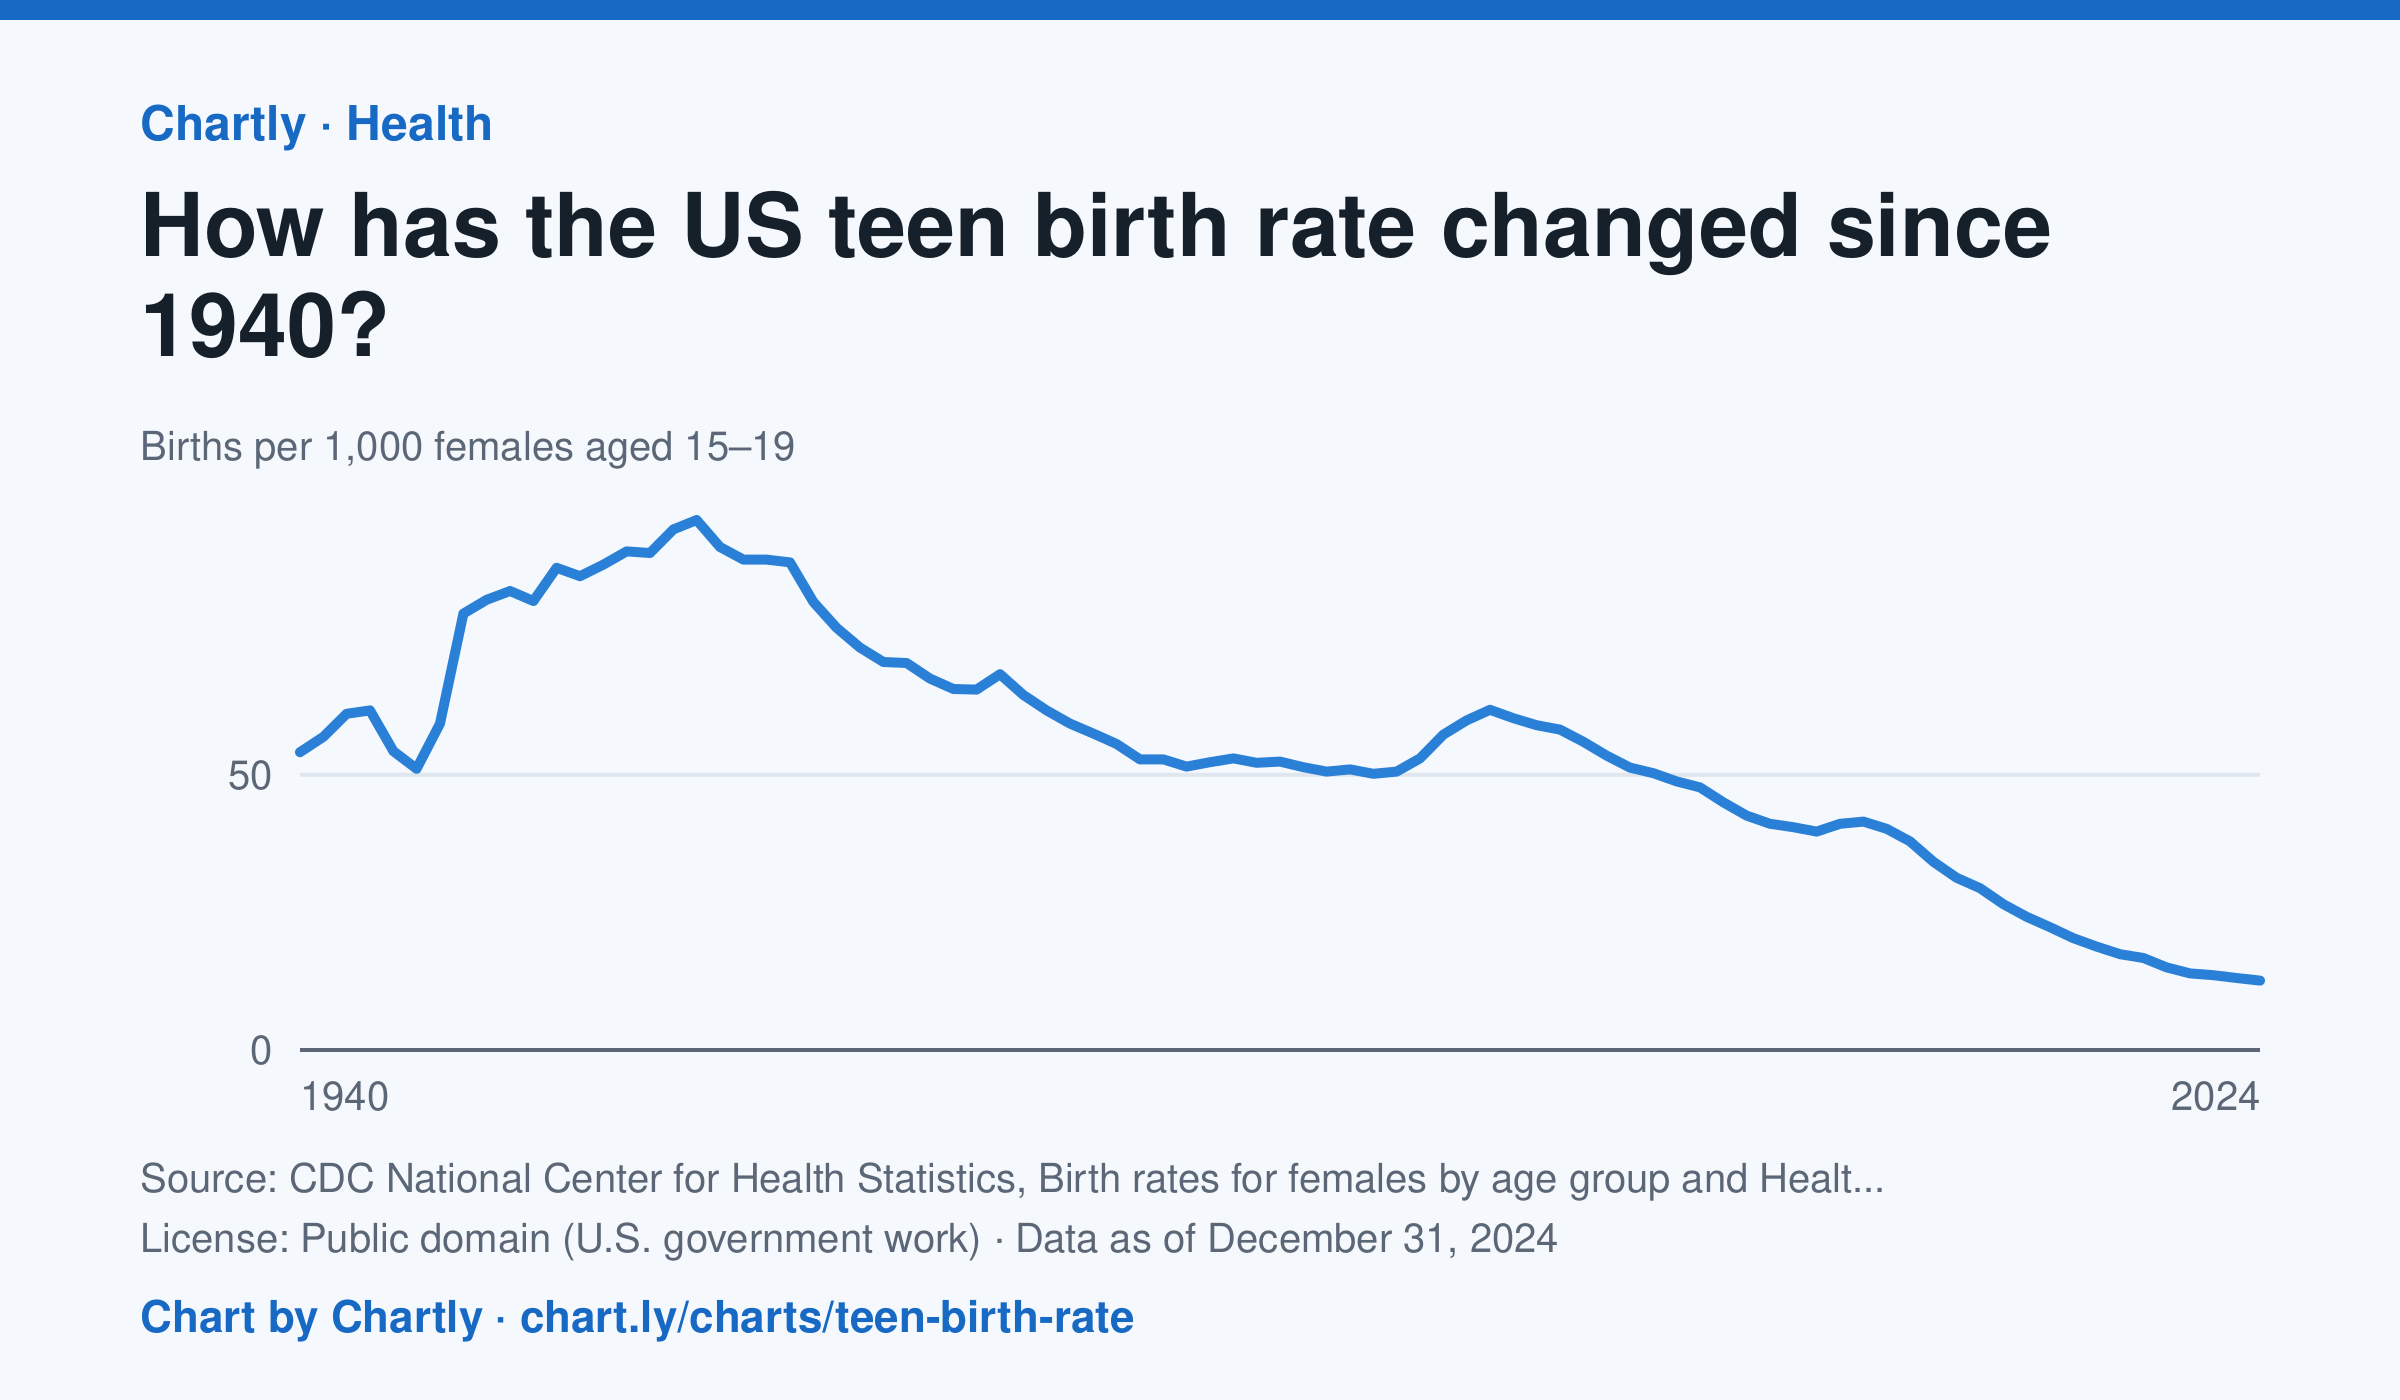
There were 12.6 births per 1,000 females aged 15 to 19 in 2024. The rate has fallen about 80% since 1991 (61.8) and about 87% since its 1957 peak (96.3).
Source: CDC National Center for Health Statistics, Birth rates for females by age group and Health, United States (Public domain (U.S. government work)) · Data as of Dec 31, 2024 · Open the interactive chart and its numbers
What students answer
How to read this chart
Each point is how many babies were born in a year for every 1,000 young women aged 15 to 19. A rate is used instead of a count so that years with more or fewer teenagers can be compared fairly. Hover or tap a point to read its year and value.
Questions to discuss
- When was the teen birth rate highest, and what is it in the newest year?
- Showing your work, by about what percent has the rate fallen since its peak?
- What changes in schools, health care or society could explain the long fall since the early 1990s?
The answer key gives the chart's key numbers (newest, highest, lowest, biggest change) and, for each question, the figures it asks about, written from the same data students see.
Or assign it online
Post this link in Google Classroom, Canvas or Moodle. Students see the interactive chart and the questions; they don't need an account.
A chart for class, every Monday
One fresh chart of public data, three questions to discuss and a link that opens it as a class assignment, in your inbox each Monday. Free, no account. See this week's.