Free printable worksheet · Economics
Free inflation chart worksheet with answer key
How fast are US prices rising? A one-page worksheet on a chart of trustworthy public data, with three questions and lines to write on, plus an answer key for you. Free, no account needed, and the numbers are the newest the source has published.
The chart on the worksheet
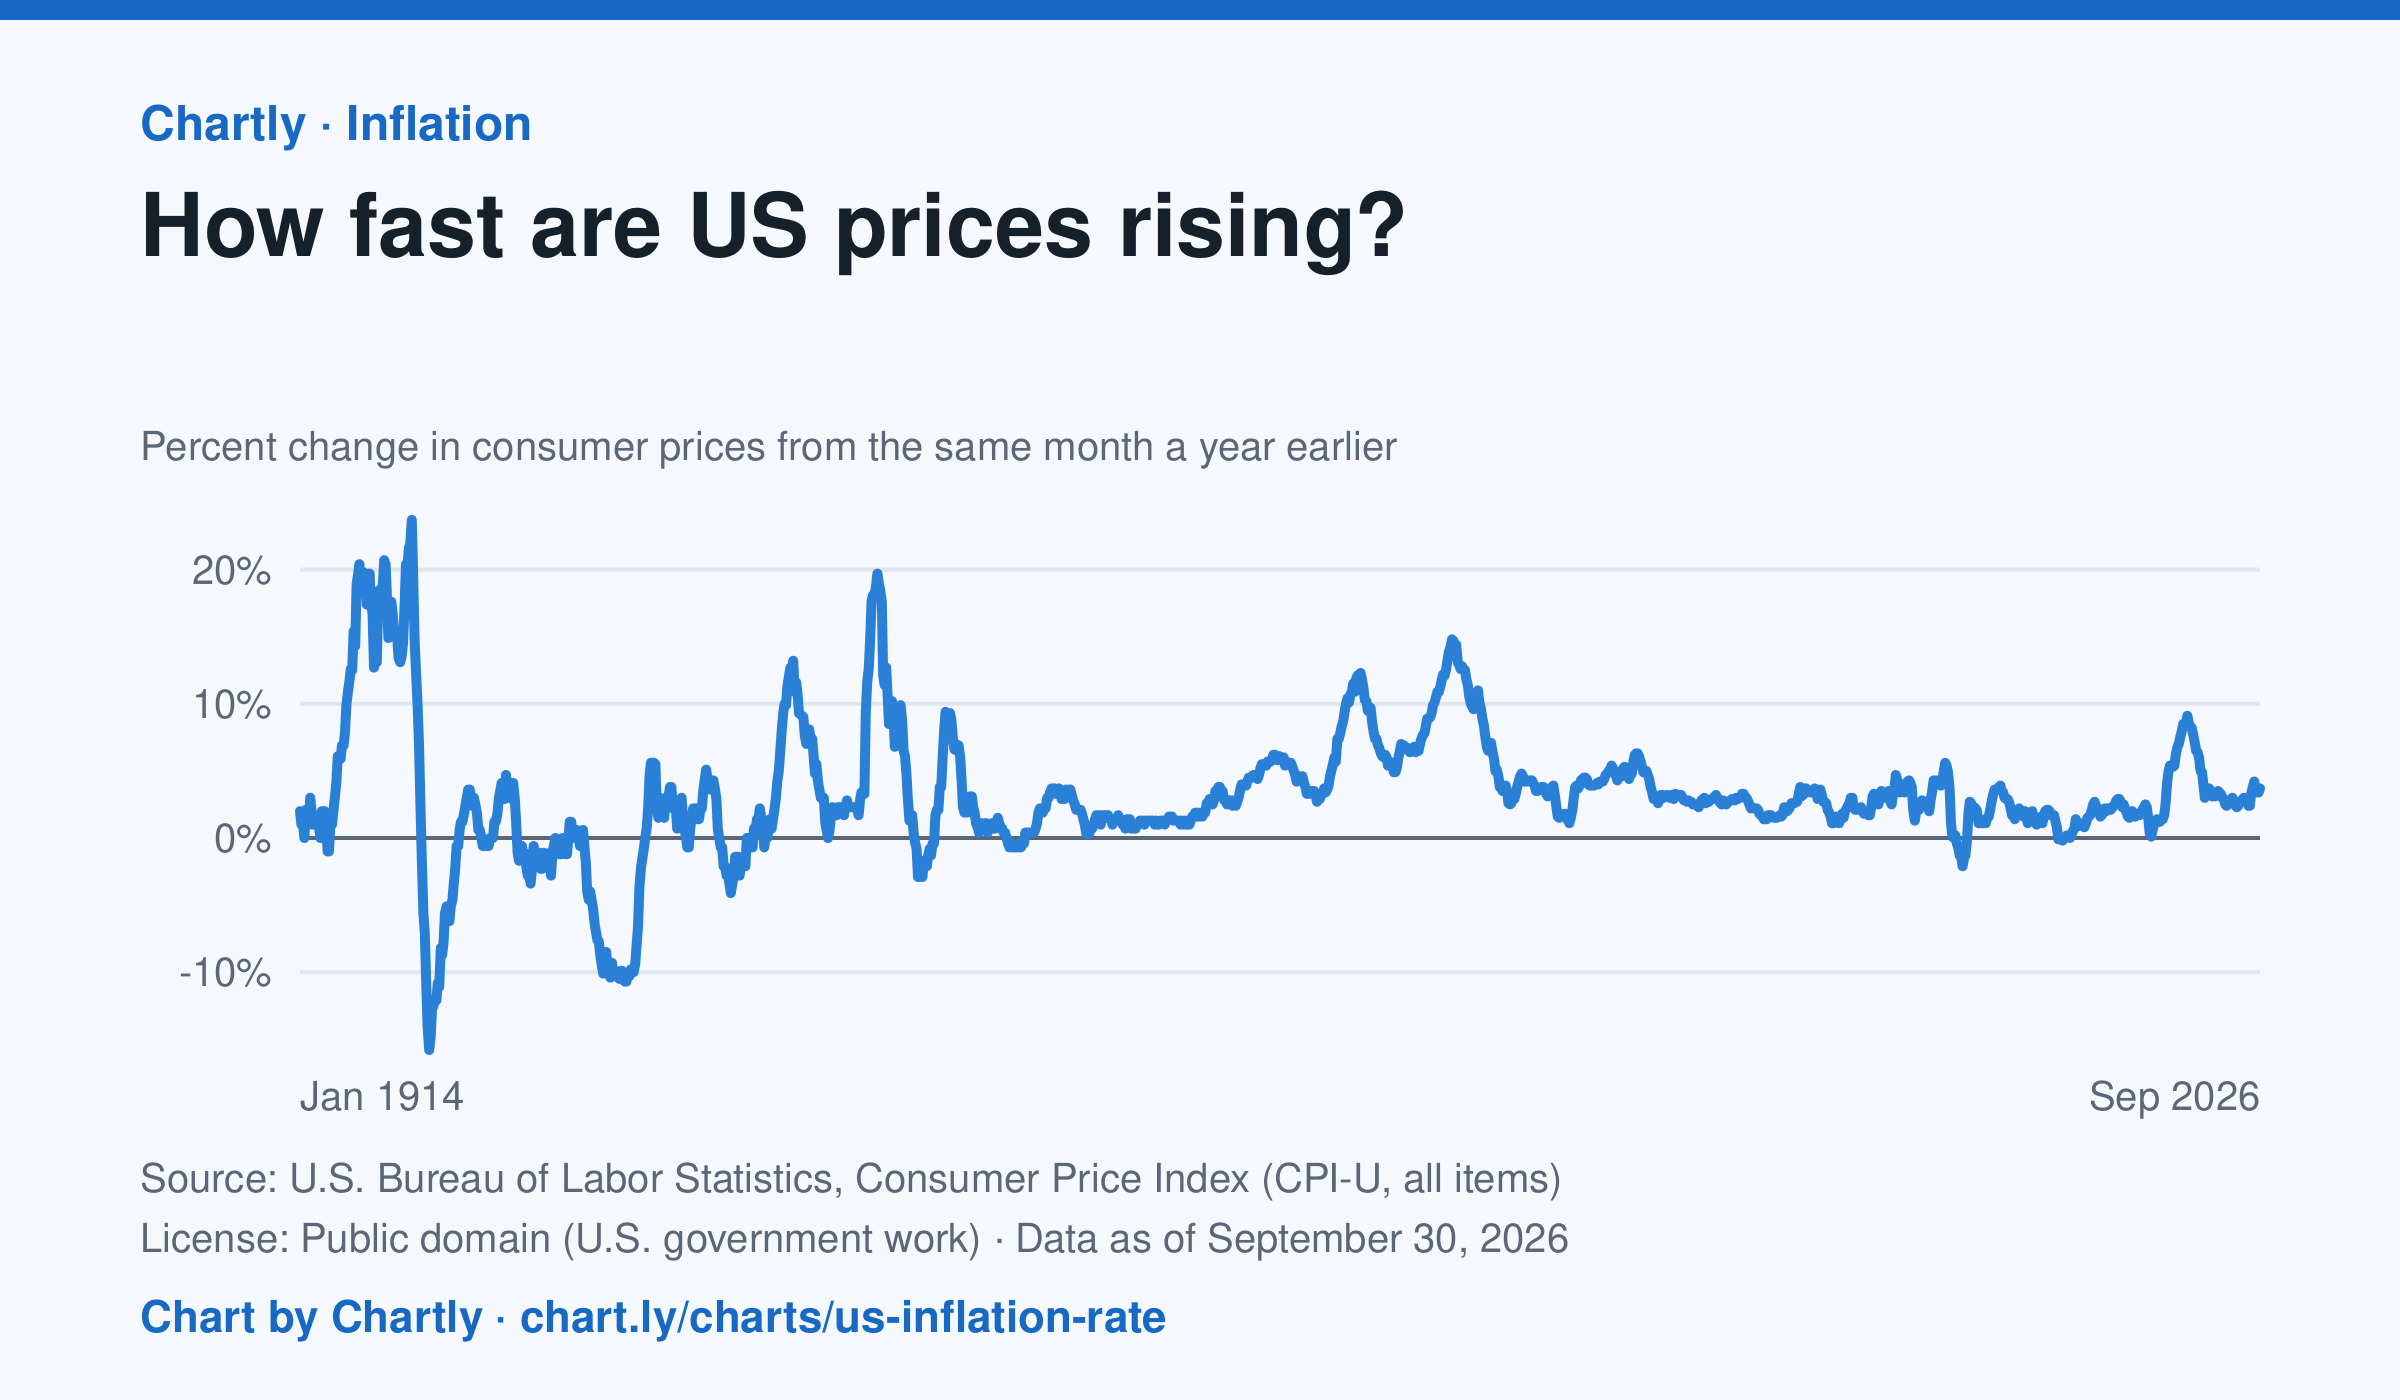
The inflation rate was 3.7% in September 2026: how much consumer prices changed from the same month a year earlier. Each point makes that comparison, back to 1914, the first year BLS can compare. Inflation peaked at 23.7% in June 1920 and at 14.8% in March 1980; the 9.1% of June 2022 was the highest since 1981. Prices fell as fast as 15.8% a year in 1921 and 10.7% in 1932. BLS collected no prices in October 2025, during a lapse in federal funding, so that month and October 2026 are missing.
Source: U.S. Bureau of Labor Statistics, Consumer Price Index (CPI-U, all items) (Public domain (U.S. government work)) · Data as of Sep 30, 2026 · Open the interactive chart and its numbers
What students answer
How to read this chart
Each point compares consumer prices in a month with the same month a year earlier. A value of 3 means things cost about 3% more than a year before; below zero means prices fell. The chart shows how fast prices change, not how high they are.
Questions to discuss
- Find two times when inflation was highest. What was happening in the country then?
- If inflation falls from 8% to 3%, are prices going down, or just rising more slowly?
- Find a stretch when the line is below zero. Why might falling prices be bad news for workers and businesses?
The answer key gives the chart's key numbers (newest, highest, lowest, biggest change) and, for each question, the figures it asks about, written from the same data students see.
Or assign it online
Post this link in Google Classroom, Canvas or Moodle. Students see the interactive chart and the questions; they don't need an account.
A chart for class, every Monday
One fresh chart of public data, three questions to discuss and a link that opens it as a class assignment, in your inbox each Monday. Free, no account. See this week's.