For students · Science fair, statistics and research
20 real-data project ideas for students
Twenty science fair, statistics and research project ideas, each built on a chart of real public data you can download: a question to investigate, the numbers, a way to analyze them and a citation. Free, with no account, and the numbers are the newest each source has published.
How to use these ideas
- Pick a question that interests you, and open its chart to see the numbers.
- Download the data. The file opens in Google Sheets, Excel or Numbers.
- Follow the analysis steps, or change them to fit your own hypothesis.
- Cite the chart and its source. Each idea has MLA, APA and Chicago citations to copy.
New to reading charts? Start with How to read a chart, a free five-lesson course.
Science fair project ideas
-
Science fair Earth science
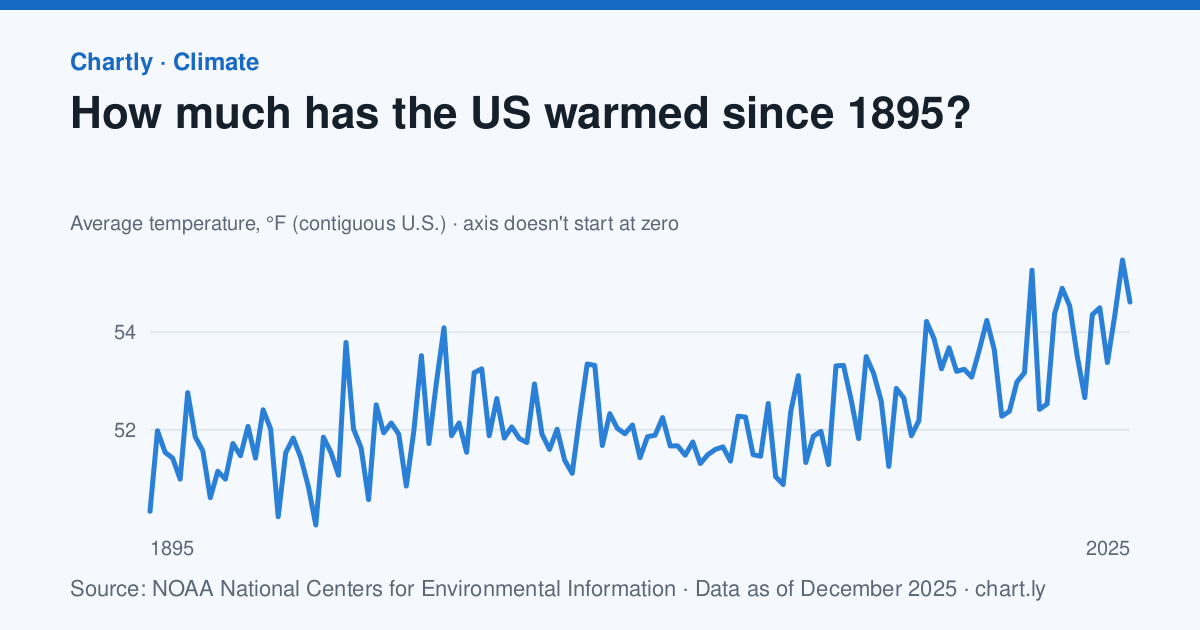
1. Is the U.S. warming faster now than it did a century ago?
The contiguous U.S. averaged 54.6°F in 2025, against 50.3°F in 1895, when NOAA's record begins.
How to analyze it
- Download the yearly temperatures and open them in Google Sheets or Excel.
- Make a scatter plot of year against temperature and add a linear trend line. Its slope is degrees per year; multiply by 10 for degrees a decade.
- Fit a second trend line to 1970 onward only and compare the two slopes. Your hypothesis is about which is steeper.
- Average each decade to smooth out single hot or cold years, and explain why one year can't prove or disprove a trend.
The data
- How much has the US warmed since 1895? Source: NOAA National Centers for Environmental Information, Climate at a Glance (Public domain (U.S. government work)), data as of December 31, 2025. Download the data (CSV)
Cite the data
How much has the US warmed since 1895?
-
MLA
“How Much Has the US Warmed Since 1895?” Chartly, 31 Dec. 2025, chart.ly/charts/us-average-temperature. Accessed 22 Nov. 2026.
-
APA
Chartly. (2025, December 31). How much has the US warmed since 1895? [Chart]. Retrieved November 22, 2026, from https://chart.ly/charts/us-average-temperature
-
Chicago
Chartly. “How Much Has the US Warmed Since 1895?” Chart. Data from NOAA National Centers for Environmental Information, Climate at a Glance. Updated December 31, 2025. Accessed November 22, 2026. https://chart.ly/charts/us-average-temperature.
-
Science fair Earth science
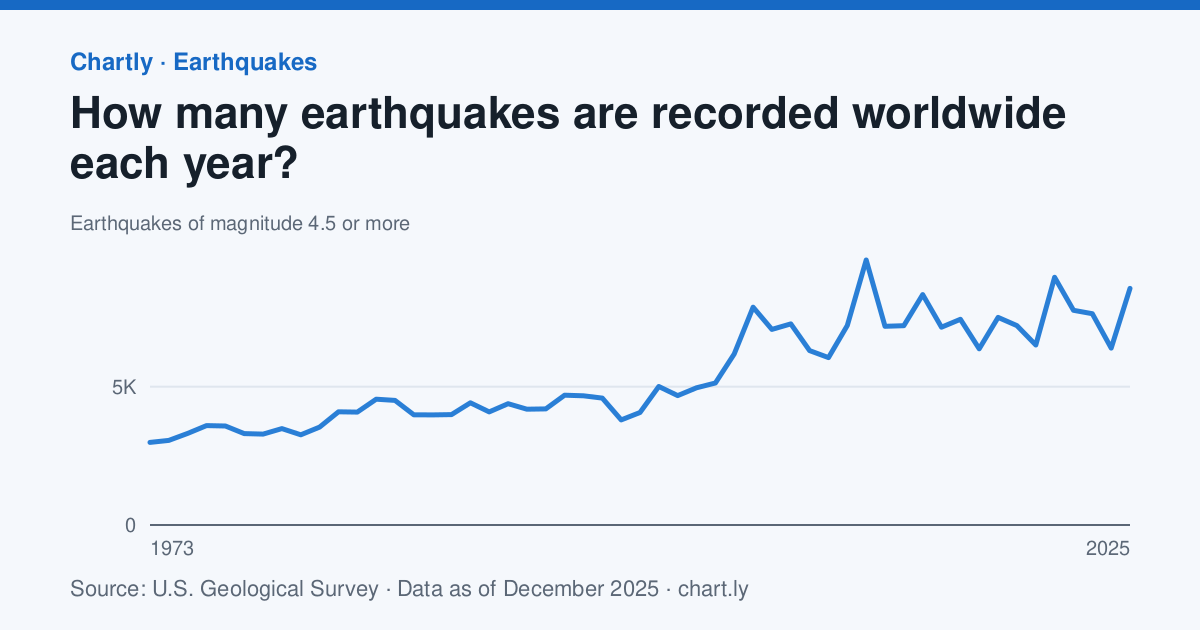
2. Are there really more earthquakes now, or just better ways to detect them?
Seismographs recorded 8,556 earthquakes of magnitude 4.5 or more in 2025, against 2,987 in 1973.
How to analyze it
- Plot both charts, the count of magnitude 4.5 or more and the count of magnitude 7 or more, over the same years.
- Work out each count's percent change from the 1970s to the last 10 years.
- Test the hypothesis: if detection improved, small quakes should rise much more than big ones, which sensors have always caught.
- Read how the U.S. Geological Survey's networks grew and explain detection bias, when a count rises because the tool measuring it changed.
The data
- How many earthquakes are recorded worldwide each year? Source: U.S. Geological Survey, ANSS Comprehensive Earthquake Catalog (ComCat) (Public domain (U.S. government work); source U.S. Geological Survey), data as of December 31, 2025. Download the data (CSV)
- How many major earthquakes happen each year? Source: U.S. Geological Survey, ANSS Comprehensive Earthquake Catalog (ComCat) (Public domain (U.S. government work); source U.S. Geological Survey), data as of December 31, 2025. Download the data (CSV)
Cite the data
How many earthquakes are recorded worldwide each year?
-
MLA
“How Many Earthquakes Are Recorded Worldwide Each Year?” Chartly, 31 Dec. 2025, chart.ly/charts/earthquakes-recorded-per-year. Accessed 22 Nov. 2026.
-
APA
Chartly. (2025, December 31). How many earthquakes are recorded worldwide each year? [Chart]. Retrieved November 22, 2026, from https://chart.ly/charts/earthquakes-recorded-per-year
-
Chicago
Chartly. “How Many Earthquakes Are Recorded Worldwide Each Year?” Chart. Data from U.S. Geological Survey, ANSS Comprehensive Earthquake Catalog (ComCat). Updated December 31, 2025. Accessed November 22, 2026. https://chart.ly/charts/earthquakes-recorded-per-year.
How many major earthquakes happen each year?
-
MLA
“How Many Major Earthquakes Happen Each Year?” Chartly, 31 Dec. 2025, chart.ly/charts/major-earthquakes-per-year. Accessed 22 Nov. 2026.
-
APA
Chartly. (2025, December 31). How many major earthquakes happen each year? [Chart]. Retrieved November 22, 2026, from https://chart.ly/charts/major-earthquakes-per-year
-
Chicago
Chartly. “How Many Major Earthquakes Happen Each Year?” Chart. Data from U.S. Geological Survey, ANSS Comprehensive Earthquake Catalog (ComCat). Updated December 31, 2025. Accessed November 22, 2026. https://chart.ly/charts/major-earthquakes-per-year.
-
Science fair Physics
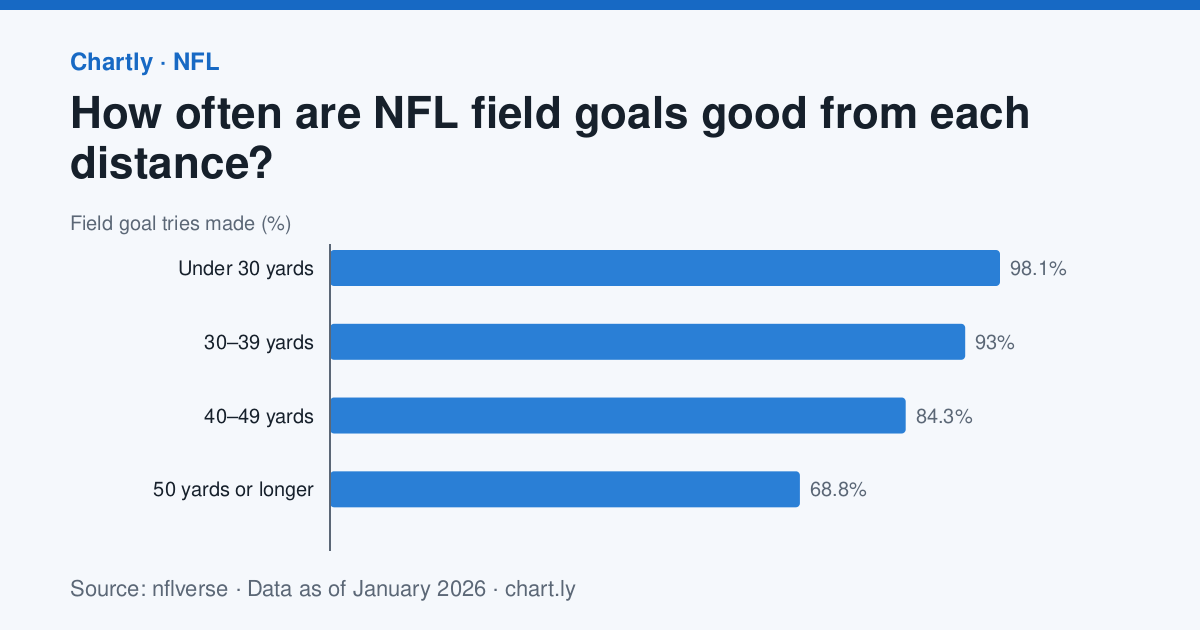
3. How much does distance matter for a field goal, and can you test it yourself?
NFL kickers made 98.1% of field goal tries from under 30 yards and 68.8% from 50 yards or longer in the season that ended in January 2026.
How to analyze it
- Plot accuracy against the middle of each distance range and estimate how much it drops every 10 yards.
- {"Run your own test" => "kick a ball (or flick a paper football) at a target from five distances, 20 tries each, and record how many go in."}
- Plot your results next to the NFL's and compare the shapes of the two curves.
- Explain the physics: an aim that is off by the same small angle misses by more the farther the ball travels.
The data
- How often are NFL field goals good from each distance? Source: nflverse, NFL team season stats (nflverse-data) (CC BY 4.0 (nflverse)), data as of January 4, 2026. Download the data (CSV)
- How often are 50-yard NFL field goals good? Source: nflverse, NFL team season stats (nflverse-data) (CC BY 4.0 (nflverse)), data as of January 4, 2026. Download the data (CSV)
Cite the data
How often are NFL field goals good from each distance?
-
MLA
“How Often Are NFL Field Goals Good From Each Distance?” Chartly, 4 Jan. 2026, chart.ly/charts/nfl-field-goal-accuracy-by-distance. Accessed 22 Nov. 2026.
-
APA
Chartly. (2026, January 4). How often are NFL field goals good from each distance? [Chart]. Retrieved November 22, 2026, from https://chart.ly/charts/nfl-field-goal-accuracy-by-distance
-
Chicago
Chartly. “How Often Are NFL Field Goals Good From Each Distance?” Chart. Data from nflverse, NFL team season stats (nflverse-data). Updated January 4, 2026. Accessed November 22, 2026. https://chart.ly/charts/nfl-field-goal-accuracy-by-distance.
How often are 50-yard NFL field goals good?
-
MLA
“How Often Are 50-yard NFL Field Goals Good?” Chartly, 4 Jan. 2026, chart.ly/charts/nfl-long-field-goal-accuracy. Accessed 22 Nov. 2026.
-
APA
Chartly. (2026, January 4). How often are 50-yard NFL field goals good? [Chart]. Retrieved November 22, 2026, from https://chart.ly/charts/nfl-long-field-goal-accuracy
-
Chicago
Chartly. “How Often Are 50-yard NFL Field Goals Good?” Chart. Data from nflverse, NFL team season stats (nflverse-data). Updated January 4, 2026. Accessed November 22, 2026. https://chart.ly/charts/nfl-long-field-goal-accuracy.
-
Science fair Statistics
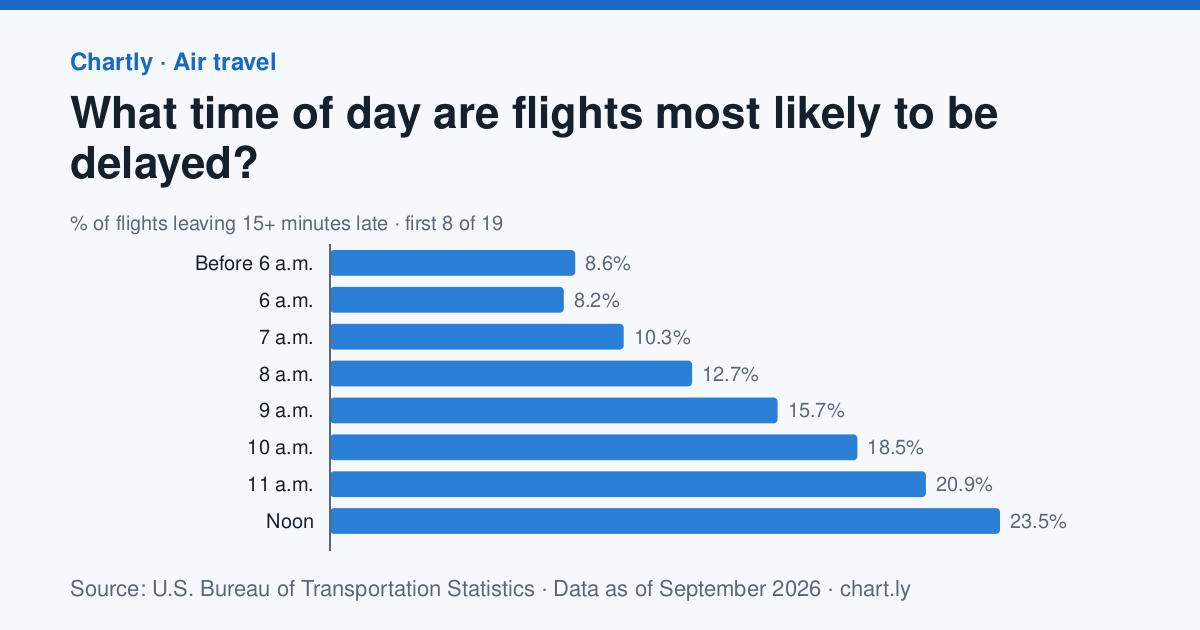
4. Do flights get later as the day goes on?
In the 12 months to September 2026, 8.2% of flights scheduled to leave between 6 and 7 a.m. left 15 or more minutes late, against 36.5% of those leaving between 8 and 9 p.m.
How to analyze it
- Plot the share of late flights for each departure hour and find the worst hour.
- Number the hours from 6 a.m. and work out the correlation between hour and late share (CORREL in a spreadsheet).
- Model the knock-on effect: if one plane flies five trips a day and each late arrival delays the next trip, how does a 10-minute delay at 7 a.m. grow?
- Look up your nearest airport's page on Chartly and compare its hours with the U.S. as a whole.
The data
- What time of day are flights most likely to be delayed? Source: U.S. Bureau of Transportation Statistics, Airline On-Time Performance (Reporting Carrier On-Time Performance, 1987–present) (Public domain (U.S. government work)), data as of September 30, 2026. Download the data (CSV)
Cite the data
What time of day are flights most likely to be delayed?
-
MLA
“What Time of Day Are Flights Most Likely to Be Delayed?” Chartly, 30 Sept. 2026, chart.ly/charts/flight-delays-by-time-of-day. Accessed 22 Nov. 2026.
-
APA
Chartly. (2026, September 30). What time of day are flights most likely to be delayed? [Chart]. Retrieved November 22, 2026, from https://chart.ly/charts/flight-delays-by-time-of-day
-
Chicago
Chartly. “What Time of Day Are Flights Most Likely to Be Delayed?” Chart. Data from U.S. Bureau of Transportation Statistics, Airline On-Time Performance (Reporting Carrier On-Time Performance, 1987–present). Updated September 30, 2026. Accessed November 22, 2026. https://chart.ly/charts/flight-delays-by-time-of-day.
-
Science fair Earth science
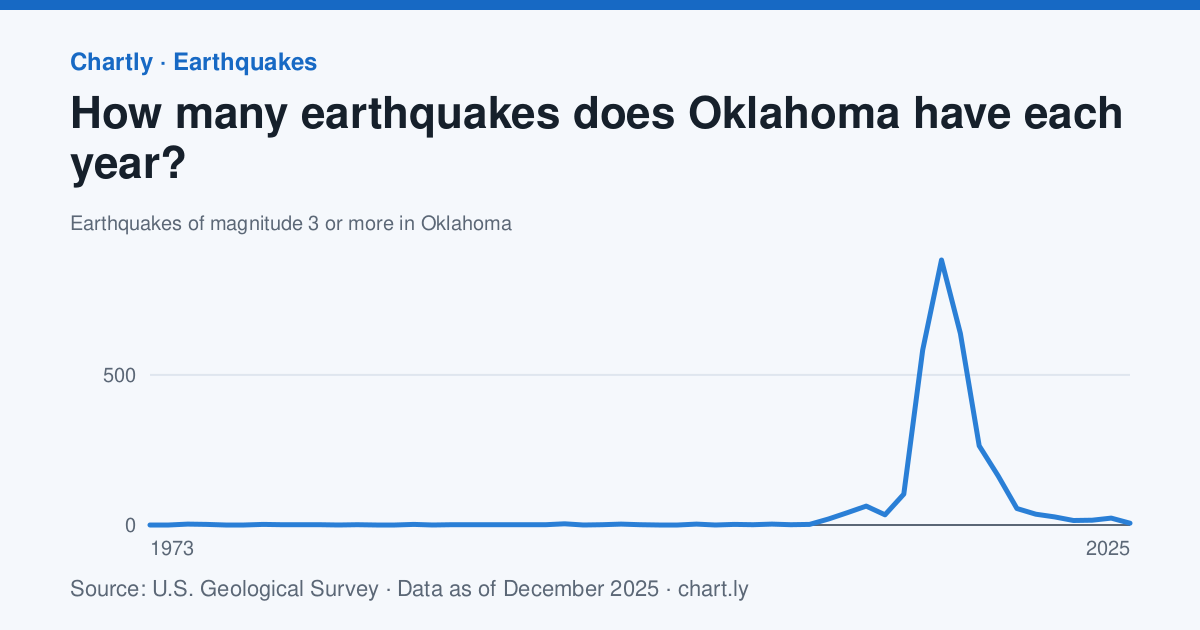
5. What made Oklahoma's earthquakes surge, and what brought them down?
Oklahoma had 883 earthquakes of magnitude 3 or more in 2015 and 6 in 2025.
How to analyze it
- Mark 2015, when Oklahoma began limiting how much oil and gas wastewater could be pumped underground, on the chart.
- Average the yearly counts before 2009, from 2009 to 2015 and after 2015, and compare them.
- Read the U.S. Geological Survey's pages on induced earthquakes and explain how injected water can make faults slip.
- Build a model with a sponge or sand tray to show how water pressure affects friction, and say what your model can't show.
The data
- How many earthquakes does Oklahoma have each year? Source: U.S. Geological Survey, ANSS Comprehensive Earthquake Catalog (ComCat) (Public domain (U.S. government work); source U.S. Geological Survey), data as of December 31, 2025. Download the data (CSV)
Cite the data
How many earthquakes does Oklahoma have each year?
-
MLA
“How Many Earthquakes Does Oklahoma Have Each Year?” Chartly, 31 Dec. 2025, chart.ly/charts/oklahoma-earthquakes-per-year. Accessed 22 Nov. 2026.
-
APA
Chartly. (2025, December 31). How many earthquakes does Oklahoma have each year? [Chart]. Retrieved November 22, 2026, from https://chart.ly/charts/oklahoma-earthquakes-per-year
-
Chicago
Chartly. “How Many Earthquakes Does Oklahoma Have Each Year?” Chart. Data from U.S. Geological Survey, ANSS Comprehensive Earthquake Catalog (ComCat). Updated December 31, 2025. Accessed November 22, 2026. https://chart.ly/charts/oklahoma-earthquakes-per-year.
Statistics project ideas
-
Statistics Statistics
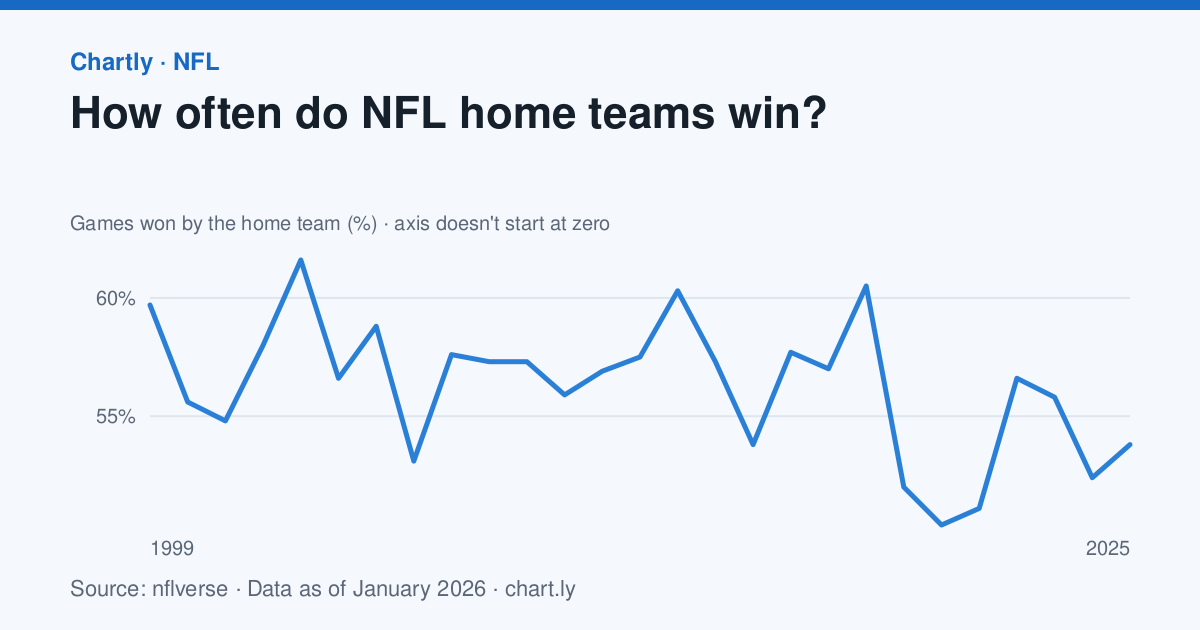
6. Is home-field advantage real, and do crowds cause it?
NFL home teams won 53.8% of regular-season games in 2025, against 59.7% in 1999.
How to analyze it
- Average the home-win share from 1999 to 2019 and compare it with 2020, a season played mostly without fans.
- About 256 games are played a season. If home teams had no edge, the share would usually land within 50% ± 6% (two standard errors, 2 × √(0.25 ÷ 256)). How many seasons fall outside that?
- Treat 2020 as a natural experiment and discuss what else changed that year besides the crowds.
- Check whether the advantage is shrinking by fitting a trend line to every season.
The data
- How often do NFL home teams win? Source: nflverse, NFL schedules and scores (nflverse-data) (CC BY 4.0 (nflverse)), data as of January 4, 2026. Download the data (CSV)
Cite the data
How often do NFL home teams win?
-
MLA
“How Often Do NFL Home Teams Win?” Chartly, 4 Jan. 2026, chart.ly/charts/nfl-home-field-advantage. Accessed 22 Nov. 2026.
-
APA
Chartly. (2026, January 4). How often do NFL home teams win? [Chart]. Retrieved November 22, 2026, from https://chart.ly/charts/nfl-home-field-advantage
-
Chicago
Chartly. “How Often Do NFL Home Teams Win?” Chart. Data from nflverse, NFL schedules and scores (nflverse-data). Updated January 4, 2026. Accessed November 22, 2026. https://chart.ly/charts/nfl-home-field-advantage.
-
Statistics Social studies
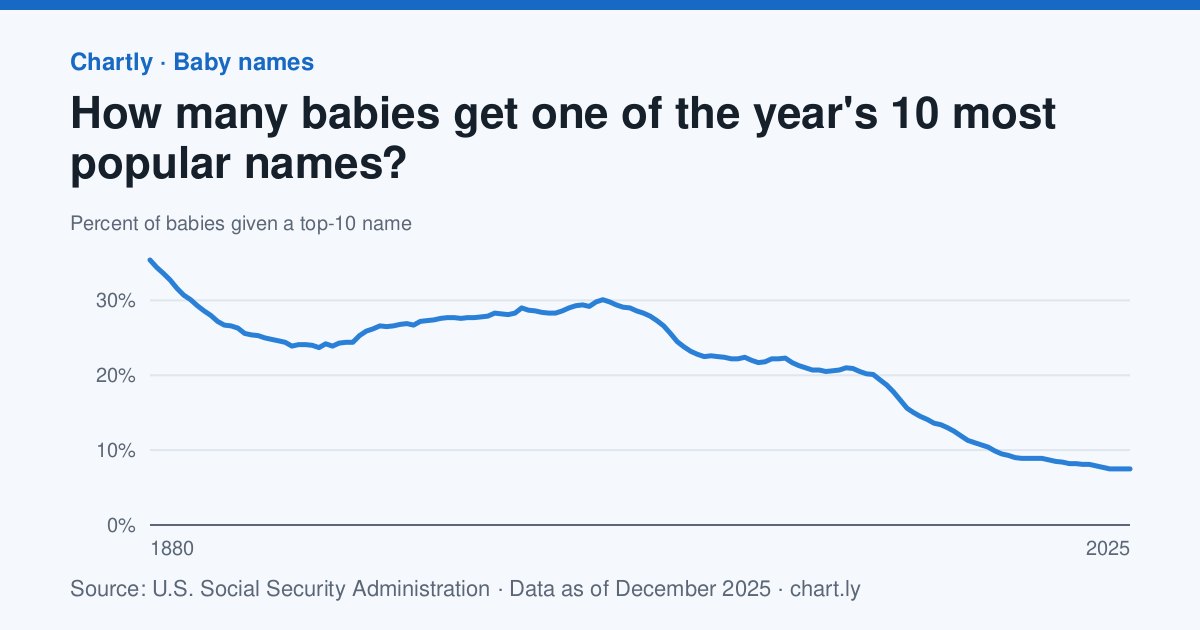
7. Are baby names getting more unique?
In 2025, 7.5% of babies got one of that year's 10 most popular names, against 29% in 1950.
How to analyze it
- Find the decade in which the share fell fastest by working out the change over each 10 years.
- Survey your class or family. What share have a top-10 name for their birth year? (Chartly's birth year pages list each year's top names.)
- Compare your sample's share with the national figure and discuss whether your sample is big enough to tell.
- Give a few reasons parents might be spreading across more names, and say which the data can and can't support.
The data
- How many babies get one of the year's 10 most popular names? Source: U.S. Social Security Administration, Baby Names from Social Security Card Applications (national data) (Public domain (U.S. government work)), data as of December 31, 2025. Download the data (CSV)
Cite the data
How many babies get one of the year's 10 most popular names?
-
MLA
“How Many Babies Get One of the Year's 10 Most Popular Names?” Chartly, 31 Dec. 2025, chart.ly/charts/share-of-babies-with-a-top-10-name. Accessed 22 Nov. 2026.
-
APA
Chartly. (2025, December 31). How many babies get one of the year's 10 most popular names? [Chart]. Retrieved November 22, 2026, from https://chart.ly/charts/share-of-babies-with-a-top-10-name
-
Chicago
Chartly. “How Many Babies Get One of the Year's 10 Most Popular Names?” Chart. Data from U.S. Social Security Administration, Baby Names from Social Security Card Applications (national data). Updated December 31, 2025. Accessed November 22, 2026. https://chart.ly/charts/share-of-babies-with-a-top-10-name.
-
Statistics Statistics
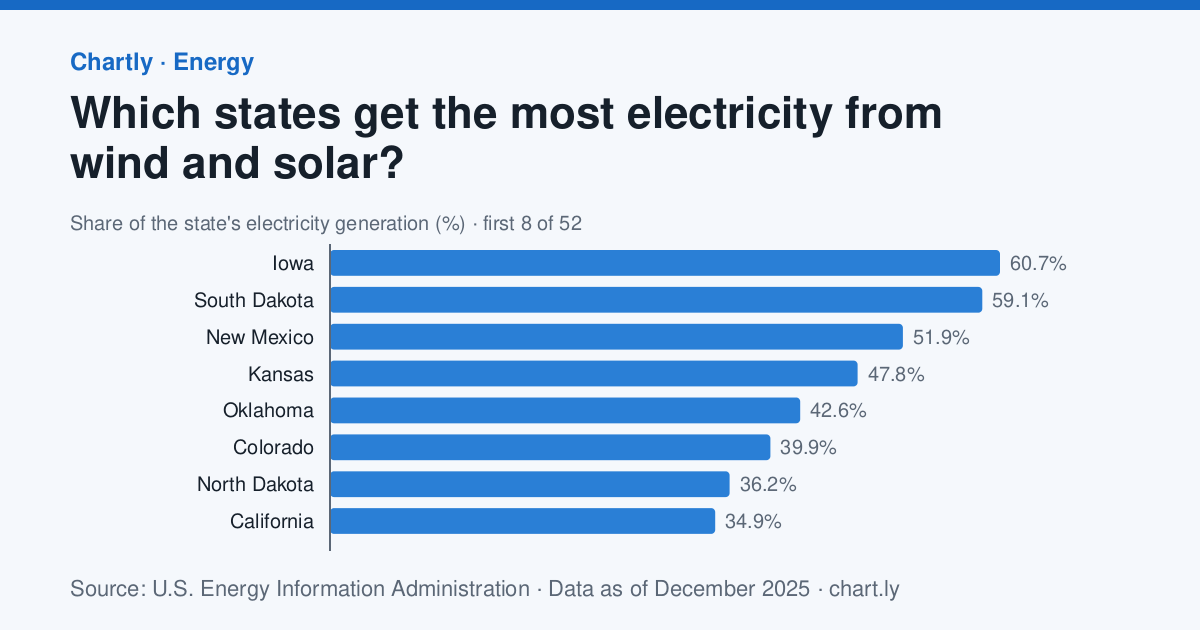
8. Do states that make more wind and solar power pay more or less for electricity?
Wind and solar made 60.7% of Iowa's electricity in 2025, and homes in Hawaii paid the most for power, 40.6 cents per kilowatt-hour.
How to analyze it
- Download both charts and match the states side by side (XLOOKUP or VLOOKUP).
- Make a scatter plot with the wind-and-solar share across and the price up, and work out the correlation coefficient.
- Find the outliers, such as Hawaii, research why they're different, then work out the correlation again without them.
- Explain why a correlation here wouldn't show that wind and solar change prices, and name another factor that could.
The data
- Which states get the most electricity from wind and solar? Source: U.S. Energy Information Administration, Electricity Data Browser (net generation by state) (Public domain (U.S. government work)), data as of December 31, 2025. Download the data (CSV)
- Which states pay the most for electricity? Source: U.S. Energy Information Administration, Electricity Data Browser (retail sales) (Public domain (U.S. government work)), data as of December 31, 2025. Download the data (CSV)
Cite the data
Which states get the most electricity from wind and solar?
-
MLA
“Which States Get the Most Electricity From Wind and Solar?” Chartly, 31 Dec. 2025, chart.ly/charts/wind-and-solar-share-of-electricity-by-state. Accessed 22 Nov. 2026.
-
APA
Chartly. (2025, December 31). Which states get the most electricity from wind and solar? [Chart]. Retrieved November 22, 2026, from https://chart.ly/charts/wind-and-solar-share-of-electricity-by-state
-
Chicago
Chartly. “Which States Get the Most Electricity From Wind and Solar?” Chart. Data from U.S. Energy Information Administration, Electricity Data Browser (net generation by state). Updated December 31, 2025. Accessed November 22, 2026. https://chart.ly/charts/wind-and-solar-share-of-electricity-by-state.
Which states pay the most for electricity?
-
MLA
“Which States Pay the Most for Electricity?” Chartly, 31 Dec. 2025, chart.ly/charts/electricity-prices-by-state. Accessed 22 Nov. 2026.
-
APA
Chartly. (2025, December 31). Which states pay the most for electricity? [Chart]. Retrieved November 22, 2026, from https://chart.ly/charts/electricity-prices-by-state
-
Chicago
Chartly. “Which States Pay the Most for Electricity?” Chart. Data from U.S. Energy Information Administration, Electricity Data Browser (retail sales). Updated December 31, 2025. Accessed November 22, 2026. https://chart.ly/charts/electricity-prices-by-state.
-
Statistics Economics
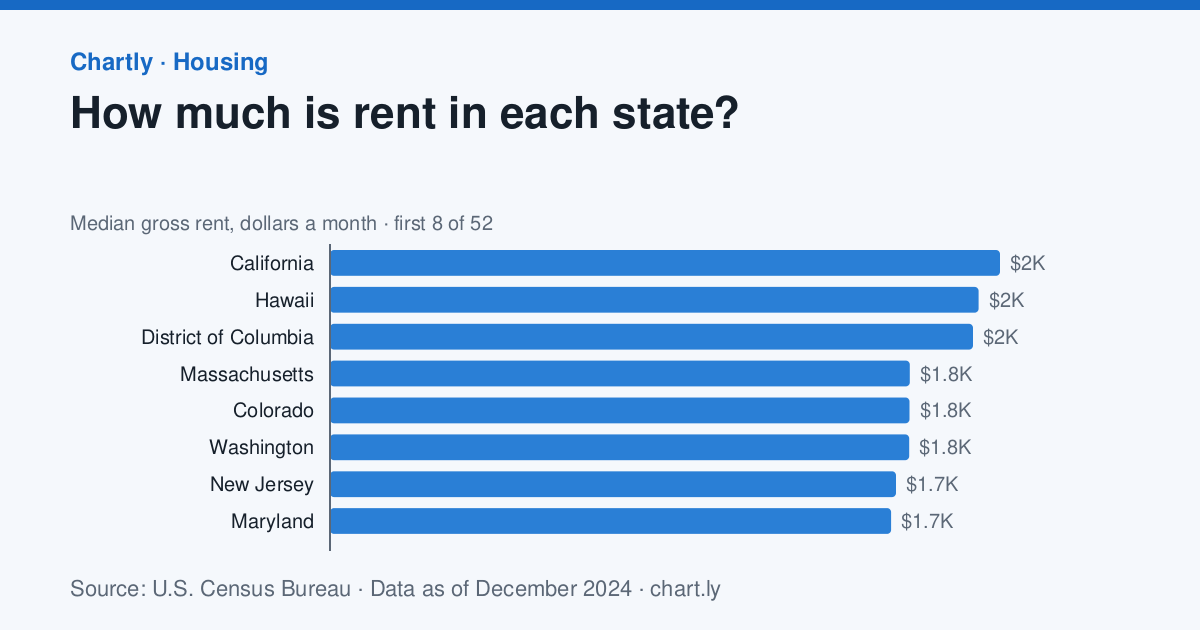
9. Do states with higher incomes have higher rents, and where is rent hardest to afford?
Median rent was highest in California, $2,036 a month, and the typical household earned the most in District of Columbia, $109,870 a year.
How to analyze it
- Match the states from both charts and plot income against rent, with a linear trend line.
- For each state, work out a year's rent as a share of income (rent × 12 ÷ income) and rank the states.
- Find the states furthest above the trend line, where rent is high for their incomes.
- Use the margin of error column to say which differences between two states are too small to call.
The data
- How much is rent in each state? Source: U.S. Census Bureau, American Community Survey 5-year estimates (Public domain (U.S. government work). This product uses the Census Bureau Data API but is not endorsed or certified by the Census Bureau.), data as of December 31, 2024. Download the data (CSV)
- What is the typical household income in each state? Source: U.S. Census Bureau, American Community Survey 5-year estimates (Public domain (U.S. government work). This product uses the Census Bureau Data API but is not endorsed or certified by the Census Bureau.), data as of December 31, 2024. Download the data (CSV)
Cite the data
How much is rent in each state?
-
MLA
“How Much Is Rent in Each State?” Chartly, 31 Dec. 2024, chart.ly/charts/median-rent-by-state. Accessed 22 Nov. 2026.
-
APA
Chartly. (2024, December 31). How much is rent in each state? [Chart]. Retrieved November 22, 2026, from https://chart.ly/charts/median-rent-by-state
-
Chicago
Chartly. “How Much Is Rent in Each State?” Chart. Data from U.S. Census Bureau, American Community Survey 5-year estimates. Updated December 31, 2024. Accessed November 22, 2026. https://chart.ly/charts/median-rent-by-state.
What is the typical household income in each state?
-
MLA
“What Is the Typical Household Income in Each State?” Chartly, 31 Dec. 2024, chart.ly/charts/median-household-income-by-state. Accessed 22 Nov. 2026.
-
APA
Chartly. (2024, December 31). What is the typical household income in each state? [Chart]. Retrieved November 22, 2026, from https://chart.ly/charts/median-household-income-by-state
-
Chicago
Chartly. “What Is the Typical Household Income in Each State?” Chart. Data from U.S. Census Bureau, American Community Survey 5-year estimates. Updated December 31, 2024. Accessed November 22, 2026. https://chart.ly/charts/median-household-income-by-state.
-
Statistics Earth science
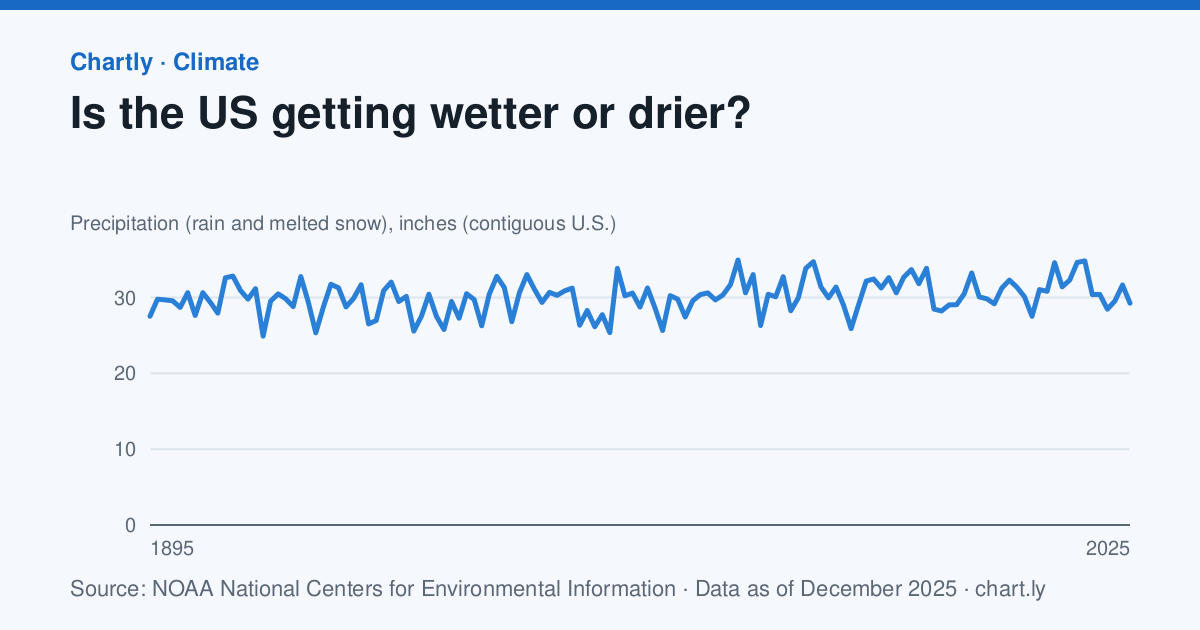
10. Is the U.S. getting wetter, and how much do single years vary?
The contiguous U.S. got 29.3 inches of rain and melted snow in 2025; the driest year since 1895 was 1910, with 24.9 inches.
How to analyze it
- Work out the mean and standard deviation of every year's precipitation.
- Count the years more than one standard deviation from the mean, wetter or drier.
- Fit a trend line and compare its rise with how much a single year swings.
- Compare how much rain and temperature vary: divide each one's standard deviation by its mean (the coefficient of variation).
The data
- Is the US getting wetter or drier? Source: NOAA National Centers for Environmental Information, Climate at a Glance (Public domain (U.S. government work)), data as of December 31, 2025. Download the data (CSV)
- How much has the US warmed since 1895? Source: NOAA National Centers for Environmental Information, Climate at a Glance (Public domain (U.S. government work)), data as of December 31, 2025. Download the data (CSV)
Cite the data
Is the US getting wetter or drier?
-
MLA
“Is the US Getting Wetter or Drier?” Chartly, 31 Dec. 2025, chart.ly/charts/us-precipitation-by-year. Accessed 22 Nov. 2026.
-
APA
Chartly. (2025, December 31). Is the US getting wetter or drier? [Chart]. Retrieved November 22, 2026, from https://chart.ly/charts/us-precipitation-by-year
-
Chicago
Chartly. “Is the US Getting Wetter or Drier?” Chart. Data from NOAA National Centers for Environmental Information, Climate at a Glance. Updated December 31, 2025. Accessed November 22, 2026. https://chart.ly/charts/us-precipitation-by-year.
How much has the US warmed since 1895?
-
MLA
“How Much Has the US Warmed Since 1895?” Chartly, 31 Dec. 2025, chart.ly/charts/us-average-temperature. Accessed 22 Nov. 2026.
-
APA
Chartly. (2025, December 31). How much has the US warmed since 1895? [Chart]. Retrieved November 22, 2026, from https://chart.ly/charts/us-average-temperature
-
Chicago
Chartly. “How Much Has the US Warmed Since 1895?” Chart. Data from NOAA National Centers for Environmental Information, Climate at a Glance. Updated December 31, 2025. Accessed November 22, 2026. https://chart.ly/charts/us-average-temperature.
-
Statistics Geography
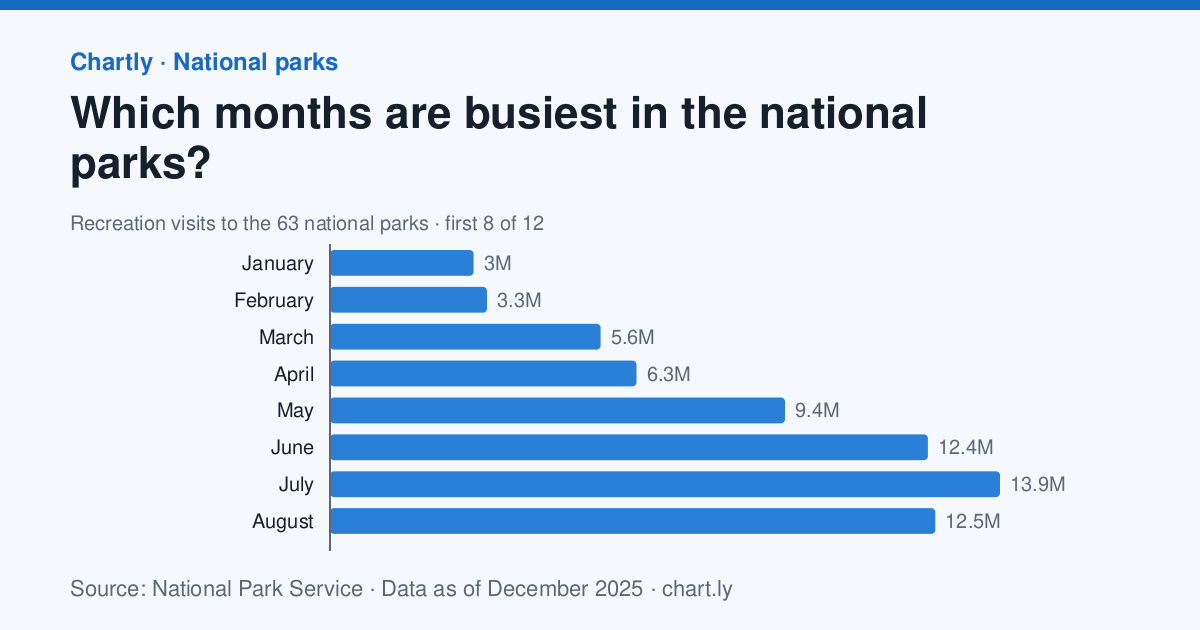
11. When are national parks busiest?
July was the busiest month of 2025 at the 63 national parks, with 13.9 million recreation visits, and January the quietest, with 2.98 million.
How to analyze it
- Work out each month's share of the year's visits and make a pie or bar chart of the seasons.
- Form a hypothesis about why summer is busiest (school holidays, weather, roads that close in winter).
- Open two parks' own pages on Chartly, one in the north and one in the desert, and compare their busiest months.
- Say whether your hypothesis explains both parks, and what other data would test it.
The data
- Which months are busiest in the national parks? Source: National Park Service, Visitor Use Statistics (Public domain (U.S. government work); source National Park Service), data as of December 31, 2025. Download the data (CSV)
Cite the data
Which months are busiest in the national parks?
-
MLA
“Which Months Are Busiest in the National Parks?” Chartly, 31 Dec. 2025, chart.ly/charts/national-park-visits-by-month. Accessed 22 Nov. 2026.
-
APA
Chartly. (2025, December 31). Which months are busiest in the national parks? [Chart]. Retrieved November 22, 2026, from https://chart.ly/charts/national-park-visits-by-month
-
Chicago
Chartly. “Which Months Are Busiest in the National Parks?” Chart. Data from National Park Service, Visitor Use Statistics. Updated December 31, 2025. Accessed November 22, 2026. https://chart.ly/charts/national-park-visits-by-month.
-
Statistics Statistics
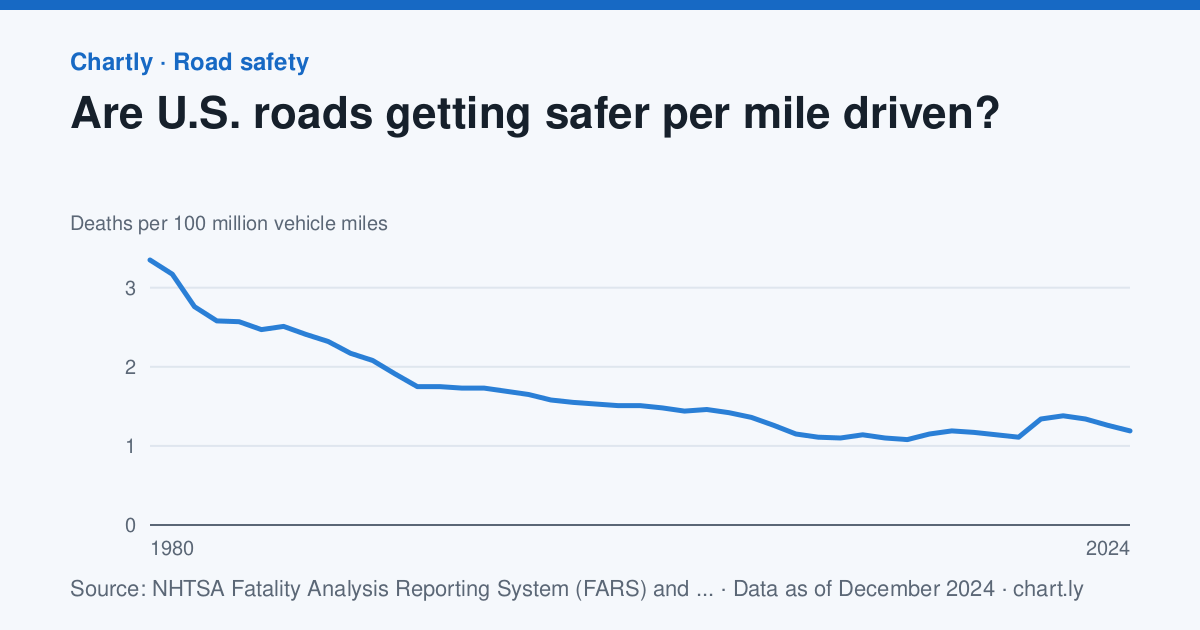
12. Are roads getting safer, or are we just driving more?
There were 1.19 deaths for every 100 million miles driven in 2024, against 3.35 in 1980.
How to analyze it
- Plot the number of deaths and the death rate per mile side by side and describe how differently they move.
- Work out the miles driven each year from the two charts: deaths ÷ rate × 100 million.
- Explain the difference between a count and a rate, and which one answers “is driving safer?”
- Look at 2020, when people drove less but the rate rose, and give possible reasons.
The data
- Are U.S. roads getting safer per mile driven? Source: NHTSA Fatality Analysis Reporting System (FARS) and FHWA Highway Statistics (table VM-2) (Public domain (U.S. government work)), data as of December 31, 2024. Download the data (CSV)
- How many people die in traffic crashes in the U.S. each year? Source: NHTSA Fatality Analysis Reporting System (FARS) (Public domain (U.S. government work)), data as of December 31, 2024. Download the data (CSV)
Cite the data
Are U.S. roads getting safer per mile driven?
-
MLA
“Are U.S. Roads Getting Safer per Mile Driven?” Chartly, 31 Dec. 2024, chart.ly/charts/traffic-deaths-per-mile-driven. Accessed 22 Nov. 2026.
-
APA
Chartly. (2024, December 31). Are U.S. roads getting safer per mile driven? [Chart]. Retrieved November 22, 2026, from https://chart.ly/charts/traffic-deaths-per-mile-driven
-
Chicago
Chartly. “Are U.S. Roads Getting Safer per Mile Driven?” Chart. Data from NHTSA Fatality Analysis Reporting System (FARS) and FHWA Highway Statistics (table VM-2). Updated December 31, 2024. Accessed November 22, 2026. https://chart.ly/charts/traffic-deaths-per-mile-driven.
How many people die in traffic crashes in the U.S. each year?
-
MLA
“How Many People Die in Traffic Crashes in the U.S. Each Year?” Chartly, 31 Dec. 2024, chart.ly/charts/us-traffic-deaths-per-year. Accessed 22 Nov. 2026.
-
APA
Chartly. (2024, December 31). How many people die in traffic crashes in the U.S. each year? [Chart]. Retrieved November 22, 2026, from https://chart.ly/charts/us-traffic-deaths-per-year
-
Chicago
Chartly. “How Many People Die in Traffic Crashes in the U.S. Each Year?” Chart. Data from NHTSA Fatality Analysis Reporting System (FARS). Updated December 31, 2024. Accessed November 22, 2026. https://chart.ly/charts/us-traffic-deaths-per-year.
-
Statistics Space science
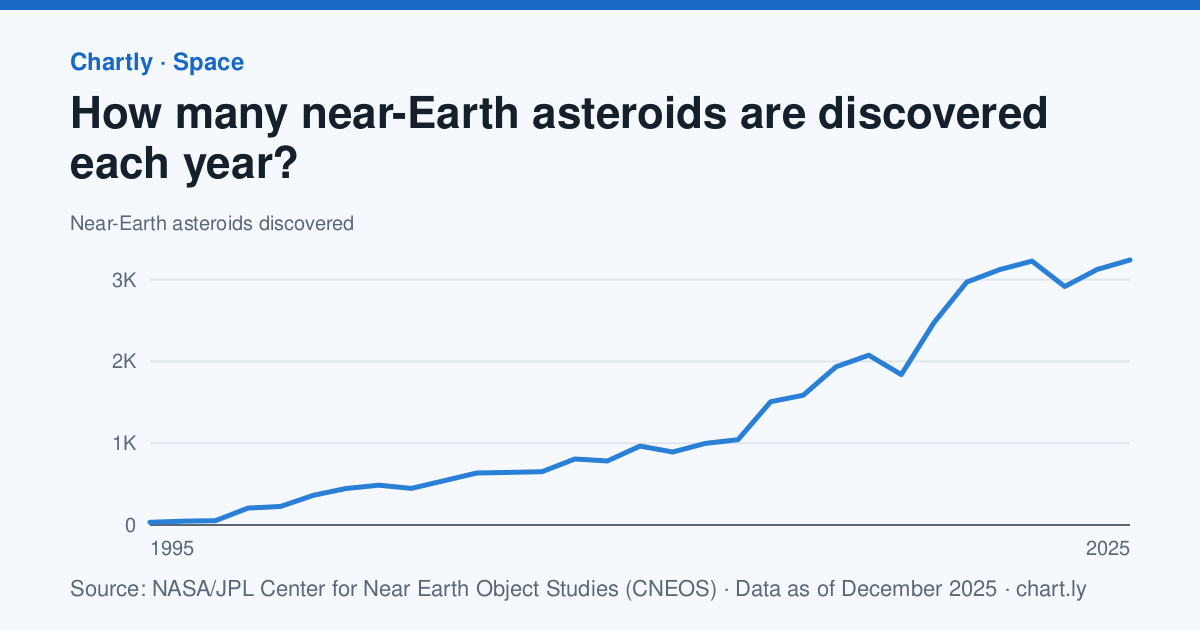
13. How fast are we finding asteroids near Earth?
Sky surveys found 3,239 new near-Earth asteroids in 2025, against 33 in 1995.
How to analyze it
- Plot the yearly finds, then plot them again on a logarithmic scale.
- Fit a linear and an exponential trend line and decide which describes the finds better.
- Add up the finds year by year to show the total known, and predict the total five years ahead.
- Research which telescope surveys started when, and say why more finds don't mean more asteroids.
The data
- How many near-Earth asteroids are discovered each year? Source: NASA/JPL Center for Near Earth Object Studies (CNEOS), Discovery Statistics (Public domain (NASA data); credit NASA/JPL-Caltech CNEOS), data as of December 31, 2025. Download the data (CSV)
Cite the data
How many near-Earth asteroids are discovered each year?
-
MLA
“How Many near-Earth Asteroids Are Discovered Each Year?” Chartly, 31 Dec. 2025, chart.ly/charts/near-earth-asteroids-discovered-per-year. Accessed 22 Nov. 2026.
-
APA
Chartly. (2025, December 31). How many near-Earth asteroids are discovered each year? [Chart]. Retrieved November 22, 2026, from https://chart.ly/charts/near-earth-asteroids-discovered-per-year
-
Chicago
Chartly. “How Many near-Earth Asteroids Are Discovered Each Year?” Chart. Data from NASA/JPL Center for Near Earth Object Studies (CNEOS), Discovery Statistics. Updated December 31, 2025. Accessed November 22, 2026. https://chart.ly/charts/near-earth-asteroids-discovered-per-year.
-
Statistics Health
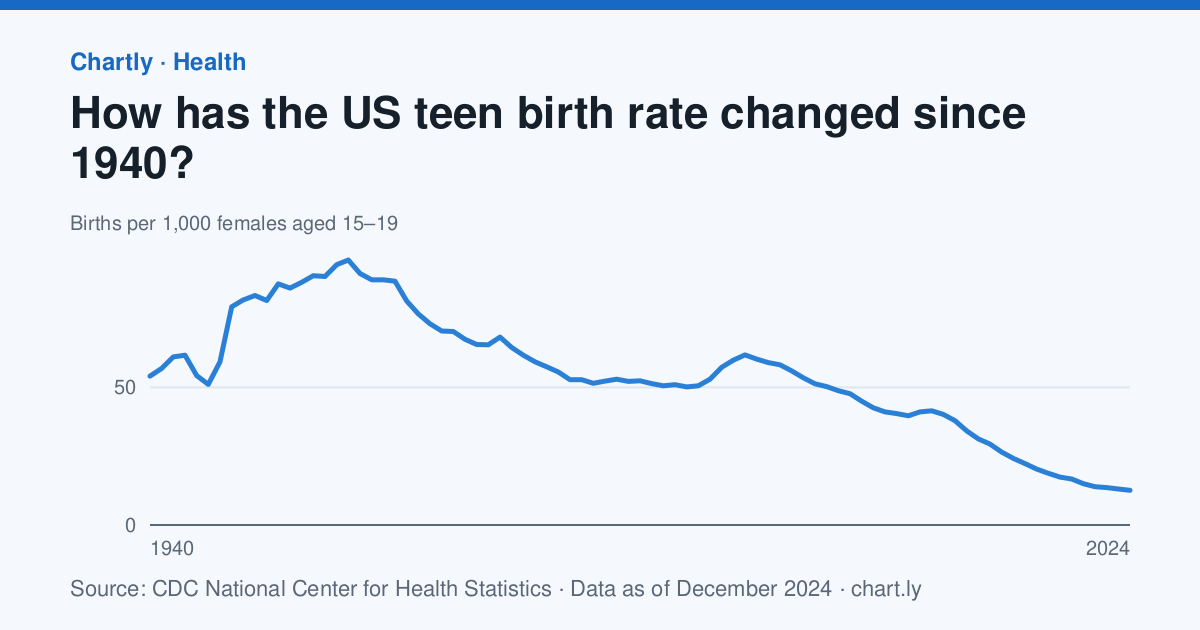
14. How much has the teen birth rate fallen, and when did the fall begin?
There were 12.6 births per 1,000 females aged 15 to 19 in 2024, against 61.8 in 1991.
How to analyze it
- Find the peak year and work out the percent change from it to the newest year.
- Fit a trend line from 1991 on and judge whether a straight line fits, or whether the fall sped up or slowed.
- Explain why the chart uses a rate per 1,000 rather than the number of births.
- Read what the CDC's National Center for Health Statistics says about the change and summarize it neutrally.
The data
- How has the US teen birth rate changed since 1940? Source: CDC National Center for Health Statistics, Birth rates for females by age group and Health, United States (Public domain (U.S. government work)), data as of December 31, 2024. Download the data (CSV)
Cite the data
How has the US teen birth rate changed since 1940?
-
MLA
“How Has the US Teen Birth Rate Changed Since 1940?” Chartly, 31 Dec. 2024, chart.ly/charts/teen-birth-rate. Accessed 22 Nov. 2026.
-
APA
Chartly. (2024, December 31). How has the US teen birth rate changed since 1940? [Chart]. Retrieved November 22, 2026, from https://chart.ly/charts/teen-birth-rate
-
Chicago
Chartly. “How Has the US Teen Birth Rate Changed Since 1940?” Chart. Data from CDC National Center for Health Statistics, Birth rates for females by age group and Health, United States. Updated December 31, 2024. Accessed November 22, 2026. https://chart.ly/charts/teen-birth-rate.
Research paper project ideas
-
Research paper Health
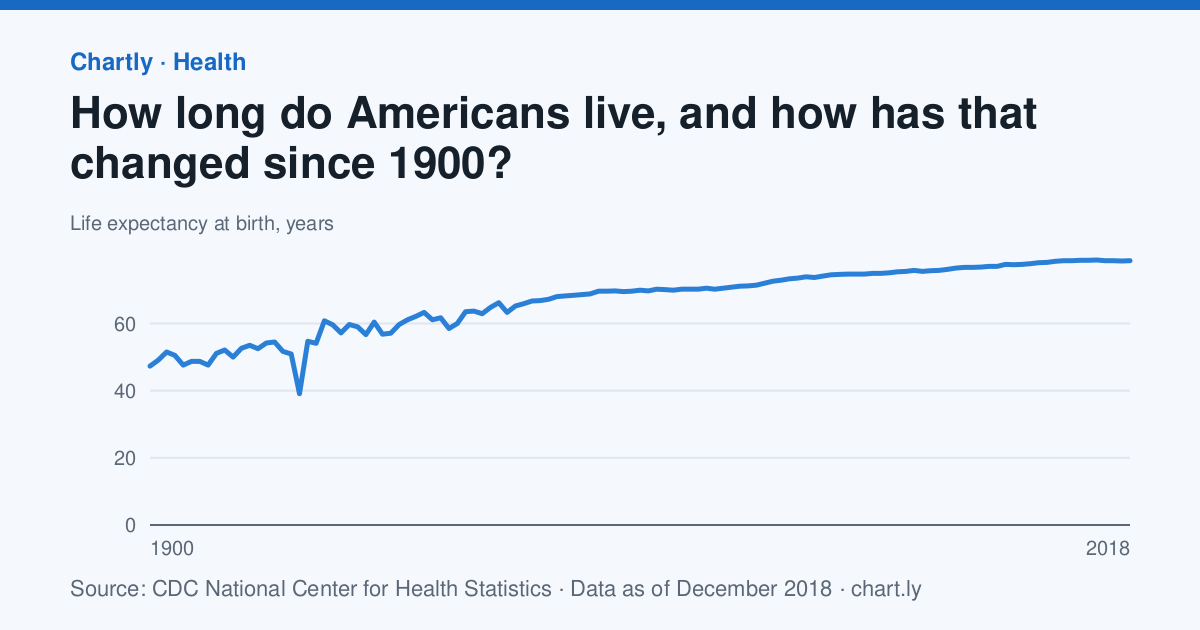
15. What made Americans' lives so much longer in the 20th century?
A baby born in the U.S. in 2018 could expect to live 78.7 years, against 47.3 in 1900.
How to analyze it
- Find the biggest year-to-year drops, such as 1918, and match each to what happened that year.
- Work out the gain in each decade and find the decade that gained the most.
- Research what changed in those decades (vaccines, antibiotics, clean water, safer births) and cite your sources.
- Note that this dataset stops in 2018, and find a newer CDC figure to bring your paper up to date.
The data
- How long do Americans live, and how has that changed since 1900? Source: CDC National Center for Health Statistics, Death rates and life expectancy at birth (Public domain (U.S. government work)), data as of December 31, 2018. Download the data (CSV)
Cite the data
How long do Americans live, and how has that changed since 1900?
-
MLA
“How Long Do Americans Live, and How Has That Changed Since 1900?” Chartly, 31 Dec. 2018, chart.ly/charts/us-life-expectancy. Accessed 22 Nov. 2026.
-
APA
Chartly. (2018, December 31). How long do Americans live, and how has that changed since 1900? [Chart]. Retrieved November 22, 2026, from https://chart.ly/charts/us-life-expectancy
-
Chicago
Chartly. “How Long Do Americans Live, and How Has That Changed Since 1900?” Chart. Data from CDC National Center for Health Statistics, Death rates and life expectancy at birth. Updated December 31, 2018. Accessed November 22, 2026. https://chart.ly/charts/us-life-expectancy.
-
Research paper Space science
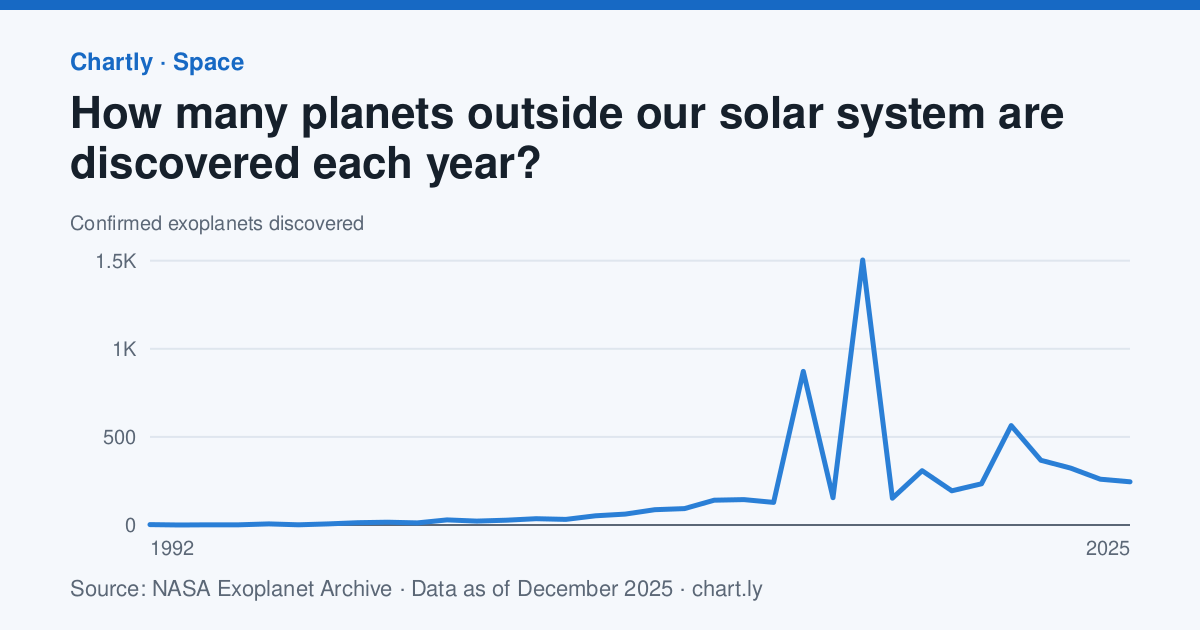
16. How did new telescopes change the pace of planet discovery?
Astronomers confirmed 245 planets around other stars in 2025; the first were found in 1992.
How to analyze it
- Mark the launches of NASA's Kepler (2009) and TESS (2018) space telescopes on the chart.
- Add up the planets found in the five years before and after each launch.
- Use the methods chart to say which way of finding planets has found the most, and explain how it works.
- Explain why recent years can still rise as late confirmations come in.
The data
- How many planets outside our solar system are discovered each year? Source: NASA Exoplanet Archive, Planetary Systems Composite Data (Public domain (NASA data); this research has made use of the NASA Exoplanet Archive, operated by Caltech under contract with NASA), data as of December 31, 2025. Download the data (CSV)
- How do astronomers find planets around other stars? Source: NASA Exoplanet Archive, Planetary Systems Composite Data (Public domain (NASA data); this research has made use of the NASA Exoplanet Archive, operated by Caltech under contract with NASA), data as of November 21, 2026. Download the data (CSV)
Cite the data
How many planets outside our solar system are discovered each year?
-
MLA
“How Many Planets Outside Our Solar System Are Discovered Each Year?” Chartly, 31 Dec. 2025, chart.ly/charts/exoplanets-discovered-per-year. Accessed 22 Nov. 2026.
-
APA
Chartly. (2025, December 31). How many planets outside our solar system are discovered each year? [Chart]. Retrieved November 22, 2026, from https://chart.ly/charts/exoplanets-discovered-per-year
-
Chicago
Chartly. “How Many Planets Outside Our Solar System Are Discovered Each Year?” Chart. Data from NASA Exoplanet Archive, Planetary Systems Composite Data. Updated December 31, 2025. Accessed November 22, 2026. https://chart.ly/charts/exoplanets-discovered-per-year.
How do astronomers find planets around other stars?
-
MLA
“How Do Astronomers Find Planets Around Other Stars?” Chartly, 21 Nov. 2026, chart.ly/charts/how-exoplanets-are-found. Accessed 22 Nov. 2026.
-
APA
Chartly. (2026, November 21). How do astronomers find planets around other stars? [Chart]. Retrieved November 22, 2026, from https://chart.ly/charts/how-exoplanets-are-found
-
Chicago
Chartly. “How Do Astronomers Find Planets Around Other Stars?” Chart. Data from NASA Exoplanet Archive, Planetary Systems Composite Data. Updated November 21, 2026. Accessed November 22, 2026. https://chart.ly/charts/how-exoplanets-are-found.
-
Research paper Economics
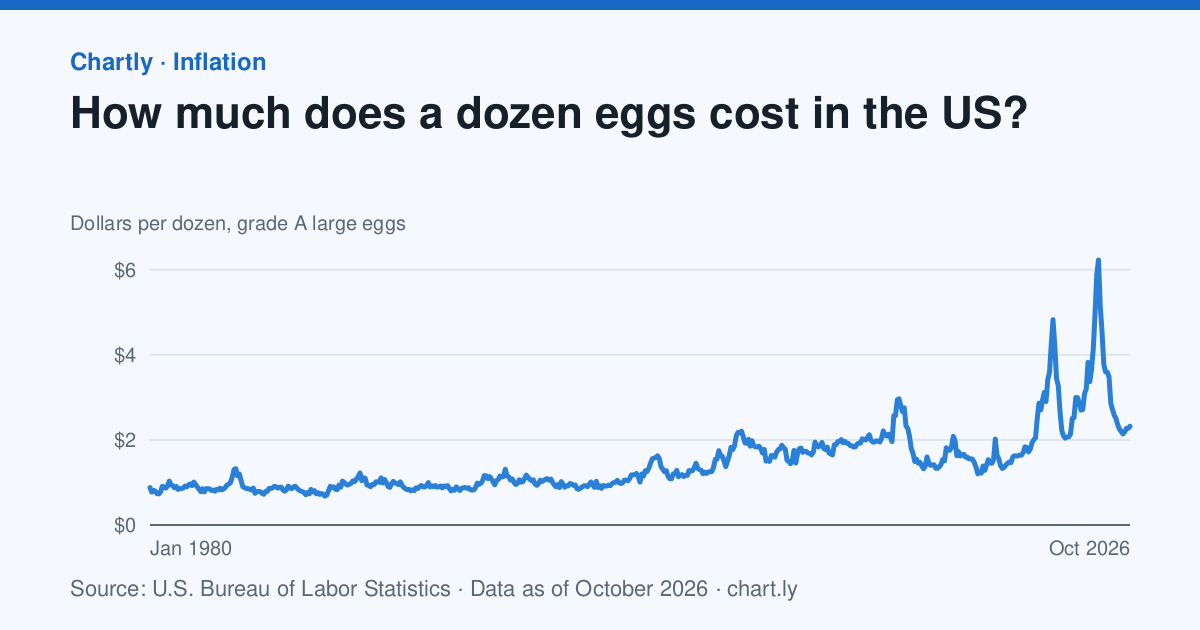
17. What makes the price of eggs jump?
A dozen grade A large eggs averaged $2.32 in October 2026; the highest month since 1980 was March 2025, at $6.23.
How to analyze it
- Mark the bird flu outbreaks that cut the number of laying hens (2015, and 2022 to 2025) and work out the percent rise after each.
- Adjust prices for inflation with the Consumer Price Index chart: price ÷ that month's index × the newest index.
- Compare the inflation-adjusted price of eggs in 1980 and today.
- Explain the spikes with supply and demand, and cite the U.S. Department of Agriculture's reports on the outbreaks.
The data
- How much does a dozen eggs cost in the US? Source: U.S. Bureau of Labor Statistics, CPI Average Price Data (eggs, grade A, large) (Public domain (U.S. government work)), data as of October 31, 2026. Download the data (CSV)
- How much have US consumer prices risen since 1913? Source: U.S. Bureau of Labor Statistics, Consumer Price Index (CPI-U, all items) (Public domain (U.S. government work)), data as of October 31, 2026. Download the data (CSV)
Cite the data
How much does a dozen eggs cost in the US?
-
MLA
“How Much Does a Dozen Eggs Cost in the US?” Chartly, 31 Oct. 2026, chart.ly/charts/egg-prices. Accessed 22 Nov. 2026.
-
APA
Chartly. (2026, October 31). How much does a dozen eggs cost in the US? [Chart]. Retrieved November 22, 2026, from https://chart.ly/charts/egg-prices
-
Chicago
Chartly. “How Much Does a Dozen Eggs Cost in the US?” Chart. Data from U.S. Bureau of Labor Statistics, CPI Average Price Data (eggs, grade A, large). Updated October 31, 2026. Accessed November 22, 2026. https://chart.ly/charts/egg-prices.
How much have US consumer prices risen since 1913?
-
MLA
“How Much Have US Consumer Prices Risen Since 1913?” Chartly, 31 Oct. 2026, chart.ly/charts/consumer-price-index. Accessed 22 Nov. 2026.
-
APA
Chartly. (2026, October 31). How much have US consumer prices risen since 1913? [Chart]. Retrieved November 22, 2026, from https://chart.ly/charts/consumer-price-index
-
Chicago
Chartly. “How Much Have US Consumer Prices Risen Since 1913?” Chart. Data from U.S. Bureau of Labor Statistics, Consumer Price Index (CPI-U, all items). Updated October 31, 2026. Accessed November 22, 2026. https://chart.ly/charts/consumer-price-index.
-
Research paper Geography
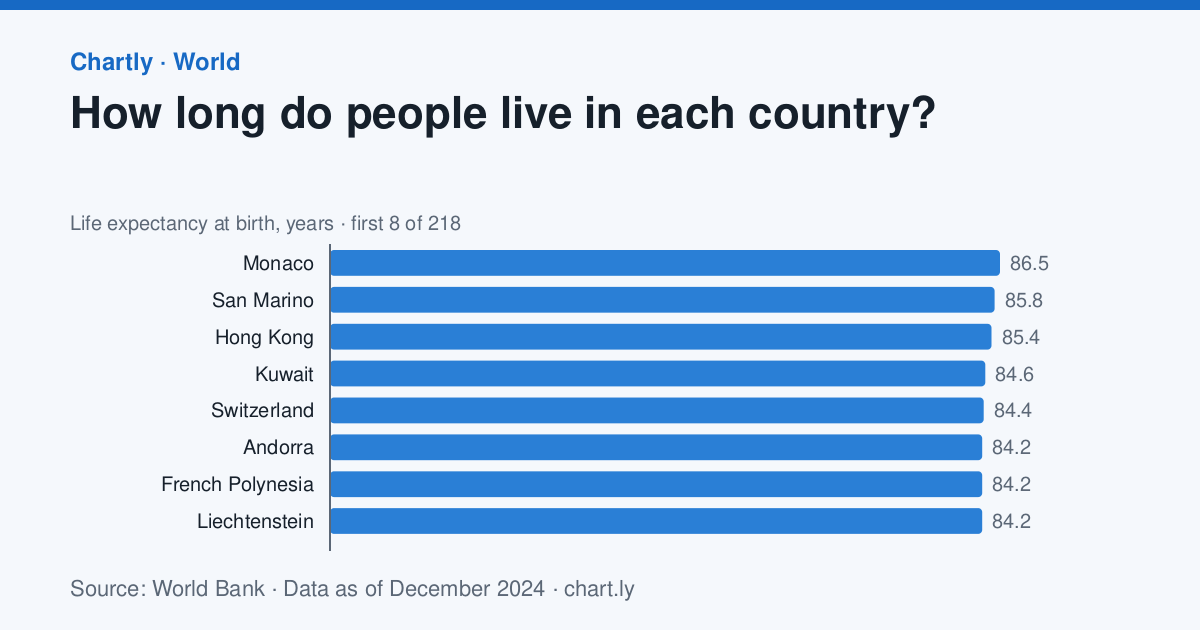
18. Do people in richer countries live longer?
A baby born in Monaco in 2024 could expect to live 86.5 years; in Nigeria, 54.6.
How to analyze it
- Match the countries in both charts and plot GDP per person against life expectancy.
- Redraw it with GDP on a logarithmic scale and describe how the shape changes.
- Pick two countries far above the curve and two far below it, and research why.
- Credit the World Bank as the source (CC BY 4.0) and note that the two charts can cover different years.
The data
- How long do people live in each country? Source: World Bank, World Development Indicators: Life expectancy at birth, total (years) (CC BY 4.0 (credit the World Bank)), data as of December 31, 2024. Download the data (CSV)
- How rich is each country, per person? Source: World Bank, World Development Indicators: GDP per capita (current US$) (CC BY 4.0 (credit the World Bank)), data as of December 31, 2024. Download the data (CSV)
Cite the data
How long do people live in each country?
-
MLA
“How Long Do People Live in Each Country?” Chartly, 31 Dec. 2024, chart.ly/charts/life-expectancy-by-country. Accessed 22 Nov. 2026.
-
APA
Chartly. (2024, December 31). How long do people live in each country? [Chart]. Retrieved November 22, 2026, from https://chart.ly/charts/life-expectancy-by-country
-
Chicago
Chartly. “How Long Do People Live in Each Country?” Chart. Data from World Bank, World Development Indicators: Life expectancy at birth, total (years). Updated December 31, 2024. Accessed November 22, 2026. https://chart.ly/charts/life-expectancy-by-country.
How rich is each country, per person?
-
MLA
“How Rich Is Each Country, per Person?” Chartly, 31 Dec. 2024, chart.ly/charts/gdp-per-person-by-country. Accessed 22 Nov. 2026.
-
APA
Chartly. (2024, December 31). How rich is each country, per person? [Chart]. Retrieved November 22, 2026, from https://chart.ly/charts/gdp-per-person-by-country
-
Chicago
Chartly. “How Rich Is Each Country, per Person?” Chart. Data from World Bank, World Development Indicators: GDP per capita (current US$). Updated December 31, 2024. Accessed November 22, 2026. https://chart.ly/charts/gdp-per-person-by-country.
-
Research paper Careers
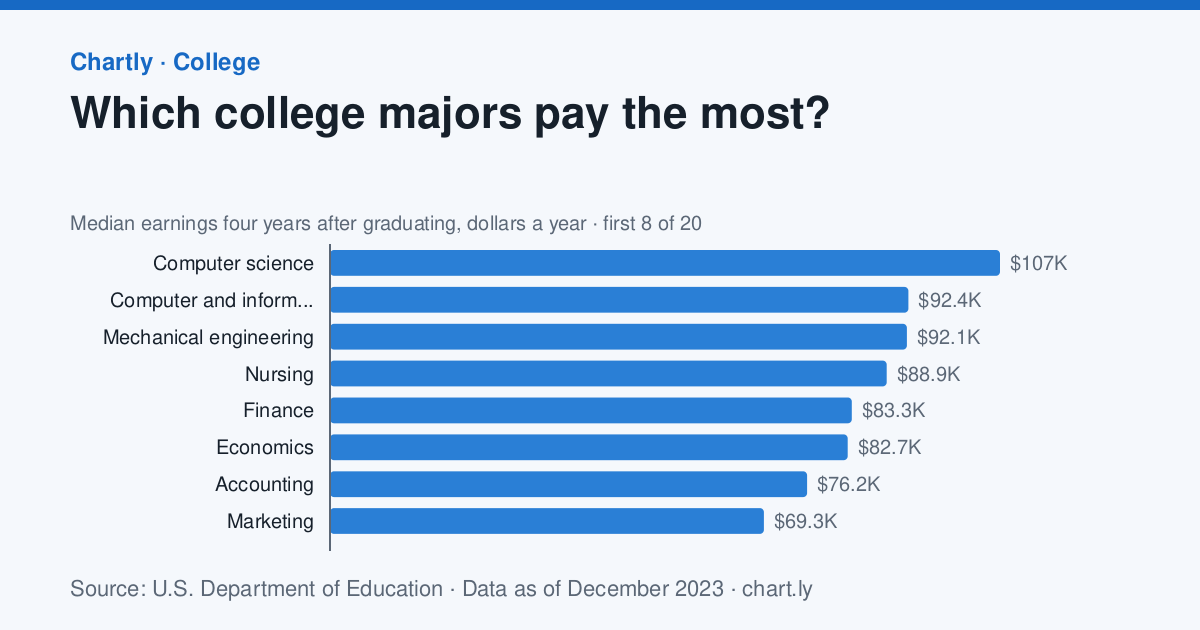
19. Which college majors pay the most, and is pay the whole story?
Of the 20 most common bachelor's degree majors, computer science paid the most four years after graduating, a median of $107,009 a year, against $47,382 for teacher education.
How to analyze it
- Rank the majors by earnings and work out how many times the top major's pay is the lowest's.
- Use the debt chart to compare what graduates owe with what they earn, and rank the majors again.
- Note that these figures cover only graduates who received federal student aid, and say how that could change them.
- Interview two adults in different careers about what they weigh besides pay, and use their answers with the data.
The data
- Which college majors pay the most? Source: U.S. Department of Education, College Scorecard (Public domain (U.S. government work)), data as of December 31, 2023. Download the data (CSV)
- How big is student debt compared with pay, by major? Source: U.S. Department of Education, College Scorecard (Public domain (U.S. government work)), data as of December 31, 2023. Download the data (CSV)
Cite the data
Which college majors pay the most?
-
MLA
“Which College Majors Pay the Most?” Chartly, 31 Dec. 2023, chart.ly/charts/earnings-by-college-major. Accessed 22 Nov. 2026.
-
APA
Chartly. (2023, December 31). Which college majors pay the most? [Chart]. Retrieved November 22, 2026, from https://chart.ly/charts/earnings-by-college-major
-
Chicago
Chartly. “Which College Majors Pay the Most?” Chart. Data from U.S. Department of Education, College Scorecard. Updated December 31, 2023. Accessed November 22, 2026. https://chart.ly/charts/earnings-by-college-major.
How big is student debt compared with pay, by major?
-
MLA
“How Big Is Student Debt Compared With Pay, by Major?” Chartly, 31 Dec. 2023, chart.ly/charts/student-debt-vs-earnings-by-major. Accessed 22 Nov. 2026.
-
APA
Chartly. (2023, December 31). How big is student debt compared with pay, by major? [Chart]. Retrieved November 22, 2026, from https://chart.ly/charts/student-debt-vs-earnings-by-major
-
Chicago
Chartly. “How Big Is Student Debt Compared With Pay, by Major?” Chart. Data from U.S. Department of Education, College Scorecard. Updated December 31, 2023. Accessed November 22, 2026. https://chart.ly/charts/student-debt-vs-earnings-by-major.
-
Research paper Geography
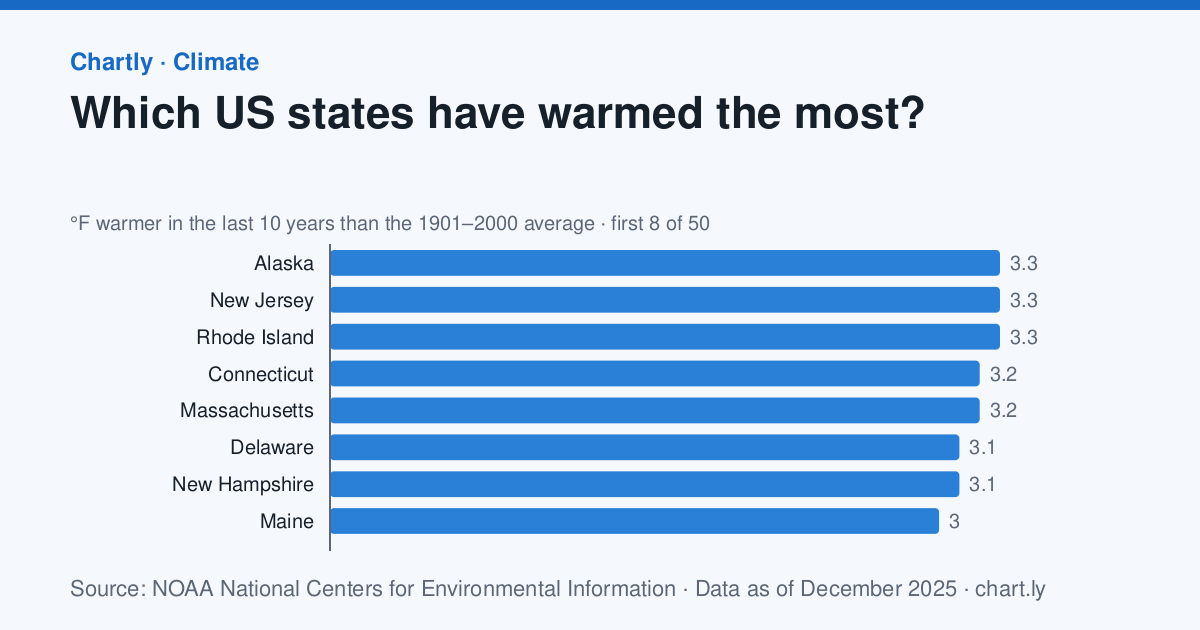
20. Which parts of the U.S. have warmed the most, and why?
In the 10 years through 2025, Alaska was 3.3°F warmer than its 1901–2000 average and Oklahoma 1.6°F; the contiguous U.S. was 2.2°F warmer.
How to analyze it
- Group the states into the Census Bureau's four regions and work out each region's average and median.
- Make a box plot by region and test the hypothesis that northern states warmed more than southern ones.
- Research why the Arctic and the Northeast warm faster, and cite NOAA's explanations.
- Note that Alaska's record starts in 1925 and Hawaii isn't included, and say how that affects your comparison.
The data
- Which US states have warmed the most? Source: NOAA National Centers for Environmental Information, Climate at a Glance (Public domain (U.S. government work)), data as of December 31, 2025. Download the data (CSV)
Cite the data
Which US states have warmed the most?
-
MLA
“Which US States Have Warmed the Most?” Chartly, 31 Dec. 2025, chart.ly/charts/warming-by-state. Accessed 22 Nov. 2026.
-
APA
Chartly. (2025, December 31). Which US states have warmed the most? [Chart]. Retrieved November 22, 2026, from https://chart.ly/charts/warming-by-state
-
Chicago
Chartly. “Which US States Have Warmed the Most?” Chart. Data from NOAA National Centers for Environmental Information, Climate at a Glance. Updated December 31, 2025. Accessed November 22, 2026. https://chart.ly/charts/warming-by-state.
Before you start
Ask your teacher what your project needs before you start. Many science fairs want an experiment you run yourself; these ideas give you real data to compare yours with, or to answer a question that can't be tested at home.
Each chart's data downloads as a CSV file that opens in Google Sheets, Excel or Numbers, with the source, license and date at the bottom. Cite the source agency as well as the Chartly page.
Numbers update when the sources publish new data, so write down the date you downloaded yours.
More data: every chart by topic, each topic's data in one file and statistics to cite.