How long do people live in each country?
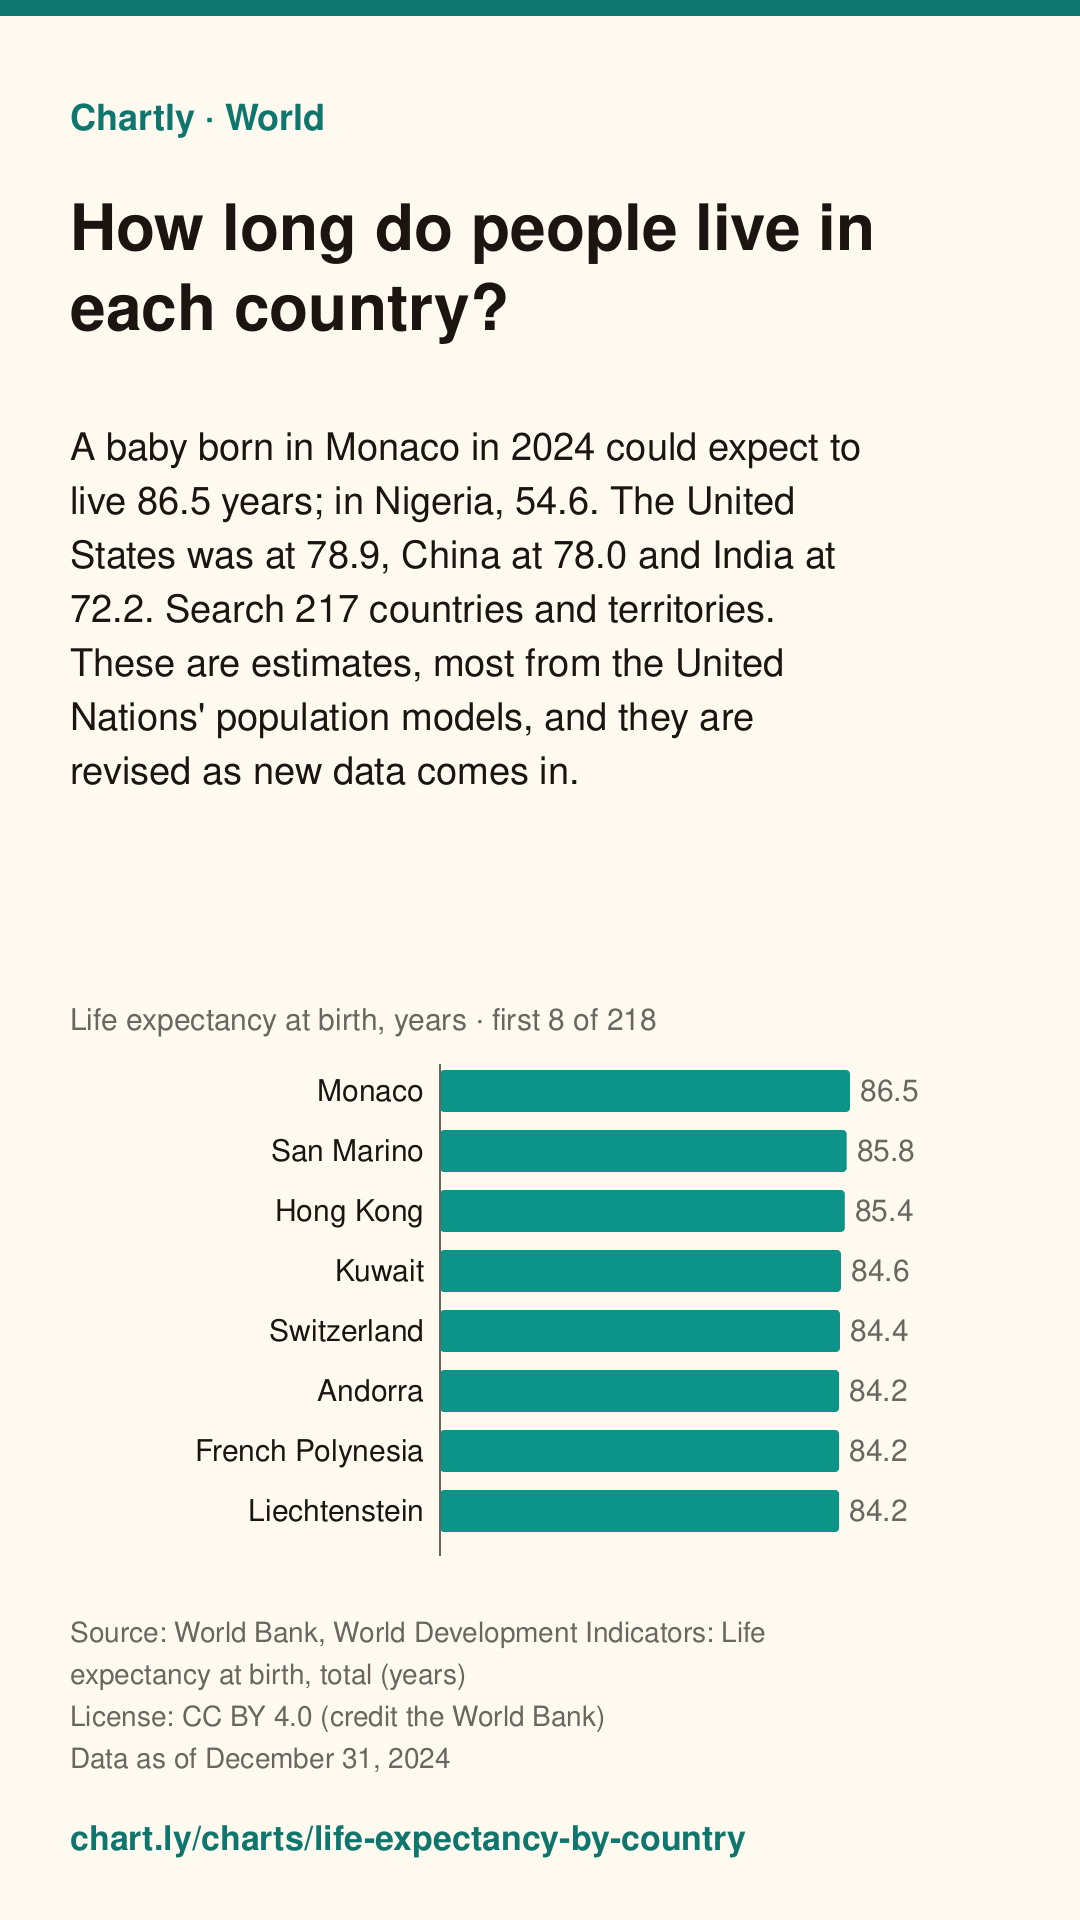
A baby born in Monaco in 2024 could expect to live 86.5 years; in Nigeria, 54.6. The United States was at 78.9, China at 78.0 and India at 72.2. Search 217 countries and territories. These are estimates, most from the United Nations' population models, and they are revised as new data comes in.
The interactive chart needs JavaScript. The numbers are in the table below.
Bars are sorted from highest to lowest and start at zero; each one's value is at its end. The dashed line is “World”, for comparison. It opens on the top and bottom 10; use “Show all” or the search box for the rest.
Save a simple drawing of this chart for slides, essays or posts, with its question, source, date and a link back to this page. Please keep the credit.
Download image
A tall picture for Pinterest or an Instagram story, with the question, answer, source, date and this page's address.
Chartly Pro: downloads and embeds without the credit. Join the waitlist
It doesn't exist yet. Tell us what you'd use it for, and we'll email you once when it's ready. Downloads and embeds with the credit stay free.
Key facts
Measure: Life expectancy at birth, years. Written from the data below.
- Monaco has the highest figure, 86.5, followed by San Marino (85.8) and Hong Kong (85.4).
- Nigeria has the lowest figure, 54.6, followed by Chad (55.2) and South Sudan (57.7).
- The highest is 1.6 times the lowest.
- World: 73.5. Of the 217 compared, 121 are above it and 96 below.
Teachers: add this chart to a class assignment, one link to post in Google Classroom, Canvas or Moodle.
Source and date
- Data as of
- Published
Citation
Chartly. “How long do people live in each country?” Chart. Data: World Bank, World Development Indicators: Life expectancy at birth, total (years), https://data.worldbank.org/indicator/SP.DYN.LE00.IN (data as of December 31, 2024). https://chart.ly/charts/life-expectancy-by-country (accessed November 4, 2026).
Free for your article, blog or class page: paste this code where the chart should go. It shows the interactive chart with its source and a small “Chart by Chartly” credit, and stays up to date when the data changes. Need it without the credit? Join the Chartly Pro waitlist.
The data
Download data (CSV)The file has the numbers in this table, with the source, license and date. Please credit the source and Chartly. Developers can also get them as JSON (how).
| Country | Life expectancy at birth, years |
|---|---|
| Monaco | 86.5 |
| San Marino | 85.8 |
| Hong Kong | 85.4 |
| Kuwait | 84.6 |
| Switzerland | 84.4 |
| Andorra | 84.2 |
| French Polynesia | 84.2 |
| Liechtenstein | 84.2 |
| Sweden | 84.1 |
| Italy | 84 |
| Japan | 84 |
| Spain | 83.9 |
| Gibraltar | 83.6 |
| South Korea | 83.6 |
| Macao | 83.3 |
| Singapore | 83.3 |
| Israel | 83.2 |
| Luxembourg | 83.2 |
| Norway | 83.2 |
| Australia | 83.1 |
| Faroe Islands | 83.1 |
| United Arab Emirates | 83.1 |
| France | 83 |
| Ireland | 83 |
| Malta | 83 |
| Iceland | 82.8 |
| Bermuda | 82.5 |
| Qatar | 82.5 |
| Portugal | 82.4 |
| Belgium | 82.3 |
| Denmark | 82.3 |
| Finland | 82.3 |
| Slovenia | 82.3 |
| Canada | 82.1 |
| Austria | 82 |
| Netherlands | 82 |
| New Zealand | 82 |
| Puerto Rico | 81.9 |
| Cyprus | 81.8 |
| Greece | 81.8 |
| Bahrain | 81.4 |
| Chile | 81.4 |
| United Kingdom | 81.4 |
| Maldives | 81.3 |
| Channel Islands | 81.2 |
| Isle of Man | 81.1 |
| Costa Rica | 81 |
| Germany | 80.8 |
| Virgin Islands (U.S.) | 80.8 |
| Cayman Islands | 80.5 |
| St. Martin (French part) | 80.4 |
| Oman | 80.2 |
| Czechia | 80 |
| Albania | 79.8 |
| Panama | 79.8 |
| Estonia | 79.3 |
| Saudi Arabia | 79 |
| Croatia | 78.9 |
| New Caledonia | 78.9 |
| Northern Mariana Islands | 78.9 |
| United States | 78.9 |
| Poland | 78.4 |
| Slovakia | 78.4 |
| Armenia | 78.3 |
| Cuba | 78.3 |
| Uruguay | 78.3 |
| Kosovo | 78.2 |
| Turks and Caicos Islands | 78.2 |
| Bosnia and Herzegovina | 78 |
| China | 78 |
| Jordan | 78 |
| Colombia | 77.9 |
| Iran | 77.9 |
| Lebanon | 77.9 |
| Montenegro | 77.9 |
| Peru | 77.9 |
| Antigua and Barbuda | 77.8 |
| Sri Lanka | 77.7 |
| Ecuador | 77.6 |
| Argentina | 77.5 |
| British Virgin Islands | 77.4 |
| Guam | 77.4 |
| Türkiye | 77.4 |
| Lithuania | 77.2 |
| Curacao | 77 |
| Malaysia | 76.8 |
| Hungary | 76.7 |
| Tunisia | 76.7 |
| North Macedonia | 76.6 |
| Thailand | 76.6 |
| Algeria | 76.5 |
| Aruba | 76.5 |
| Romania | 76.5 |
| Sint Maarten (Dutch part) | 76.5 |
| Latvia | 76.4 |
| Barbados | 76.3 |
| Seychelles | 76.3 |
| Cabo Verde | 76.2 |
| Brazil | 76 |
| Serbia | 76 |
| Bulgaria | 75.8 |
| Brunei | 75.5 |
| Morocco | 75.5 |
| Grenada | 75.4 |
| Mexico | 75.3 |
| Nicaragua | 75.1 |
| Bangladesh | 74.9 |
| Georgia | 74.7 |
| The Bahamas | 74.7 |
| Ukraine | 74.7 |
| Vietnam | 74.7 |
| Azerbaijan | 74.6 |
| Kazakhstan | 74.5 |
| Belarus | 74.4 |
| Paraguay | 74 |
| Dominican Republic | 73.9 |
| Mauritius | 73.8 |
| Suriname | 73.8 |
| Belize | 73.7 |
| North Korea | 73.7 |
| Trinidad and Tobago | 73.6 |
| Russia | 73.4 |
| Bhutan | 73.3 |
| Tonga | 73.1 |
| American Samoa | 73 |
| Honduras | 73 |
| St. Lucia | 72.8 |
| Guatemala | 72.7 |
| Venezuela | 72.7 |
| Syria | 72.6 |
| Uzbekistan | 72.5 |
| Iraq | 72.4 |
| Kyrgyzstan | 72.4 |
| Mongolia | 72.4 |
| El Salvador | 72.3 |
| St. Kitts and Nevis | 72.3 |
| India | 72.2 |
| Tajikistan | 71.9 |
| Egypt | 71.8 |
| Samoa | 71.8 |
| Vanuatu | 71.7 |
| Jamaica | 71.6 |
| St. Vincent and the Grenadines | 71.4 |
| Dominica | 71.3 |
| Indonesia | 71.3 |
| Moldova | 71.3 |
| Libya | 71.1 |
| Cambodia | 70.8 |
| Solomon Islands | 70.7 |
| Nepal | 70.6 |
| Greenland | 70.3 |
| Guyana | 70.3 |
| Turkmenistan | 70.2 |
| Philippines | 69.9 |
| Sao Tome and Principe | 69.9 |
| Palau | 69.4 |
| Yemen | 69.4 |
| Botswana | 69.3 |
| Laos | 69.2 |
| West Bank and Gaza | 69.2 |
| Eritrea | 68.9 |
| Senegal | 68.9 |
| Bolivia | 68.7 |
| Mauritania | 68.7 |
| Gabon | 68.5 |
| Uganda | 68.5 |
| Rwanda | 68 |
| Timor-Leste | 67.9 |
| Pakistan | 67.8 |
| Ethiopia | 67.6 |
| Malawi | 67.6 |
| Fiji | 67.5 |
| Namibia | 67.5 |
| Micronesia | 67.4 |
| Tuvalu | 67.3 |
| Tanzania | 67.2 |
| Marshall Islands | 67.1 |
| Myanmar | 67.1 |
| Comoros | 67 |
| Kiribati | 66.6 |
| Sudan | 66.5 |
| Zambia | 66.5 |
| Afghanistan | 66.3 |
| Papua New Guinea | 66.3 |
| South Africa | 66.3 |
| Djibouti | 66.2 |
| The Gambia | 66.1 |
| Congo (Republic) | 66 |
| Ghana | 65.7 |
| Haiti | 65.1 |
| Angola | 64.8 |
| Eswatini | 64.3 |
| Guinea-Bissau | 64.3 |
| Cameroon | 64 |
| Equatorial Guinea | 63.9 |
| Burundi | 63.8 |
| Kenya | 63.8 |
| Madagascar | 63.8 |
| Mozambique | 63.8 |
| Zimbabwe | 63.1 |
| Togo | 62.9 |
| Liberia | 62.3 |
| Nauru | 62.3 |
| Congo (Democratic Republic) | 62.1 |
| Côte d'Ivoire | 62.1 |
| Sierra Leone | 62 |
| Niger | 61.4 |
| Burkina Faso | 61.3 |
| Benin | 61 |
| Guinea | 60.9 |
| Mali | 60.7 |
| Somalia | 59 |
| Lesotho | 57.8 |
| Central African Republic | 57.7 |
| South Sudan | 57.7 |
| Chad | 55.2 |
| Nigeria | 54.6 |
| World | 73.5 |
Get new charts weekly
One email a week with the newest charts and their key numbers. No account needed.
More World charts
-
What share of people use the internet in each country?
In 2024, 94.7% of people in the United States used the internet and 64.9% in India. The highest share was 100%, and the lowest 8.6%, in Burundi. 182 countrie...
Source: World Bank, World Development Indicators: Individuals using the Internet (% of population) · Data as of Dec 31, 2024
-
How rich is each country, per person?
In 2024, Monaco produced the most goods and services (GDP) per person, $288,002, and Burundi the least, $216; the United States was at $86,170, China at $13,...
Source: World Bank, World Development Indicators: GDP per capita (current US$) · Data as of Dec 31, 2024
-
What share of people have electricity in each country?
In 2024, 99.9% of people in India had electricity. Of 215 countries and territories, South Sudan was lowest at 5.4%, then Chad (13.4%) and Malawi (15.6%); al...
Source: World Bank, World Development Indicators: Access to electricity (% of population) · Data as of Dec 31, 2024
-
How do countries compare on wealth, health and the internet?
Pick countries and compare them on GDP per person, population, life expectancy, internet use, access to electricity, unemployment, inflation, carbon emission...
Source: World Bank, World Development Indicators: GDP per capita (current US$) · Data as of Dec 31, 2024