For newsletter writers
A free chart for your newsletter
Email blocks embedded charts, so here is one that pastes. Each Monday this page offers one chart with fresh numbers from a public source: a picture, the answer in plain words, the source and a credit link. It's free, with no account. Please keep the source and the credit link.
This week's chart:
Copy it, then paste it into your draft. Here's what goes in:
Your browser wouldn't copy it, but it's now selected. Press Ctrl+C or ⌘C to copy.
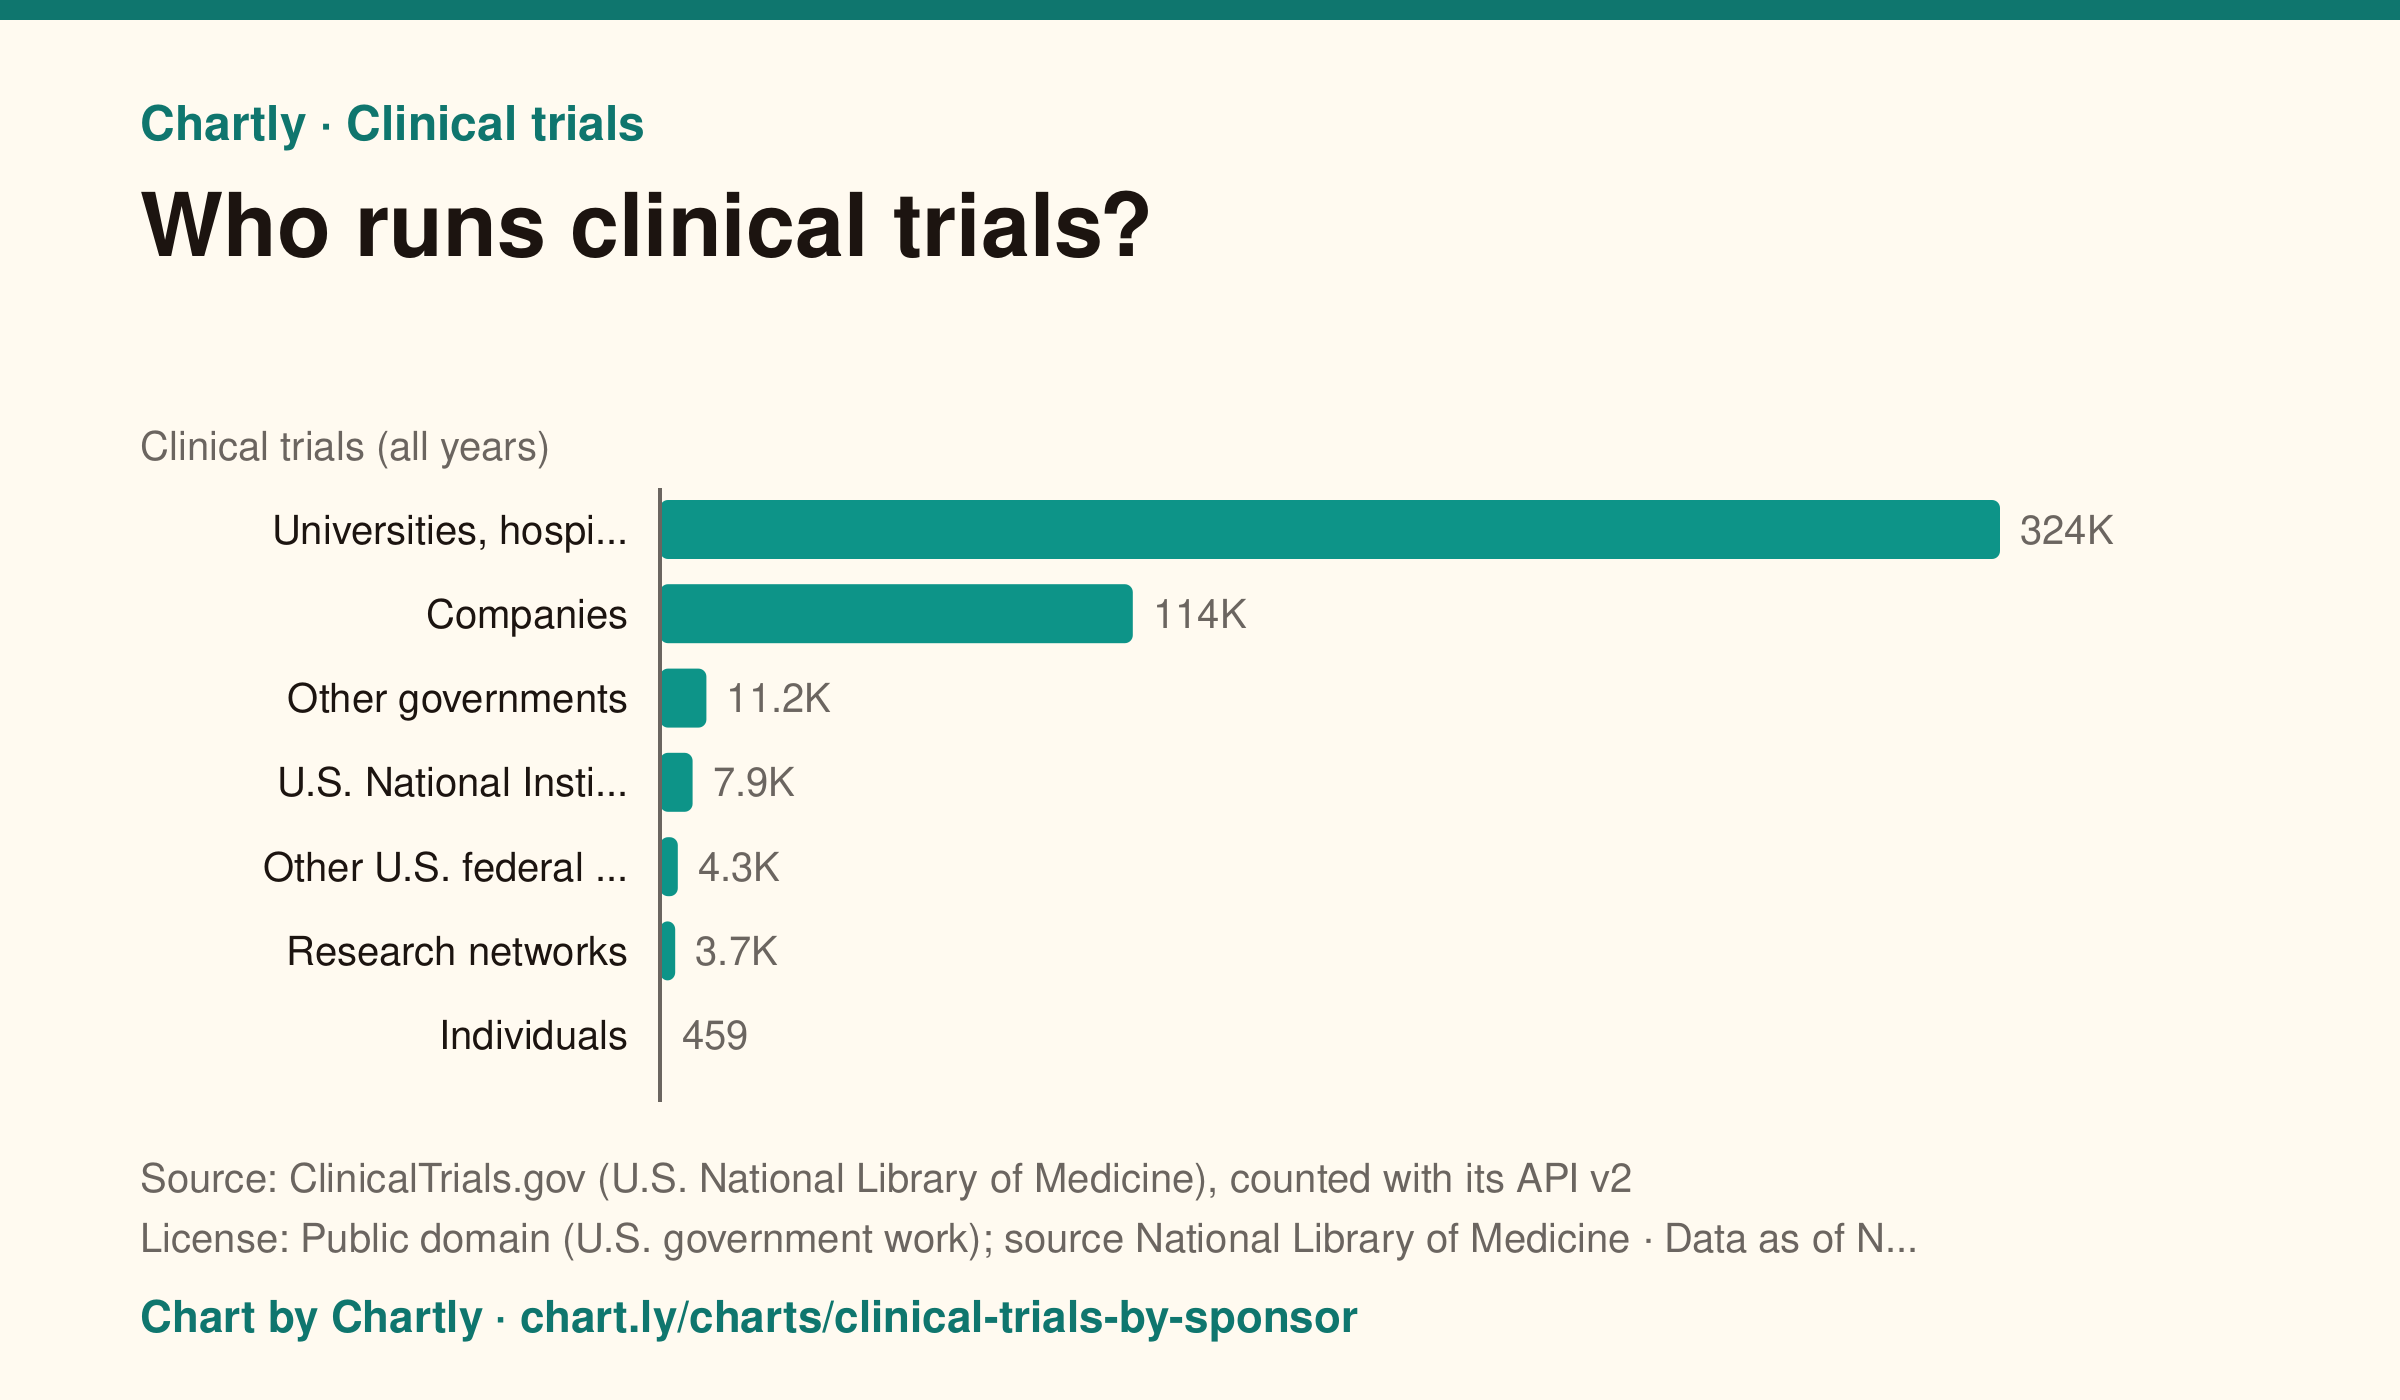
Universities, hospitals and nonprofits lead about 324,000 of the 466,000 clinical trials registered on ClinicalTrials.gov as of November 2026, or 70%. Drug, device and other companies lead about 114,000, or 25%; the U.S. National Institutes of Health leads about 7,900. The lead sponsor is the organization responsible for the trial; others may help pay for it.
Source: ClinicalTrials.gov (U.S. National Library of Medicine), counted with its API v2. License: Public domain (U.S. government work); source National Library of Medicine. Data as of November 5, 2026. Chart by Chartly.
If your editor drops the picture, download it and add it by hand. Open the chart to check its numbers first.

Copy it as HTML or plain text
Writing about something else? Any chart in the library has a picture to download, and new data this week lists the latest numbers with citations.