Free printable worksheet · Science
Free electricity sources chart worksheet with answer key
Where does US electricity come from? A one-page worksheet on a chart of trustworthy public data, with three questions and lines to write on, plus an answer key for you. Free, no account needed, and the numbers are the newest the source has published.
The chart on the worksheet
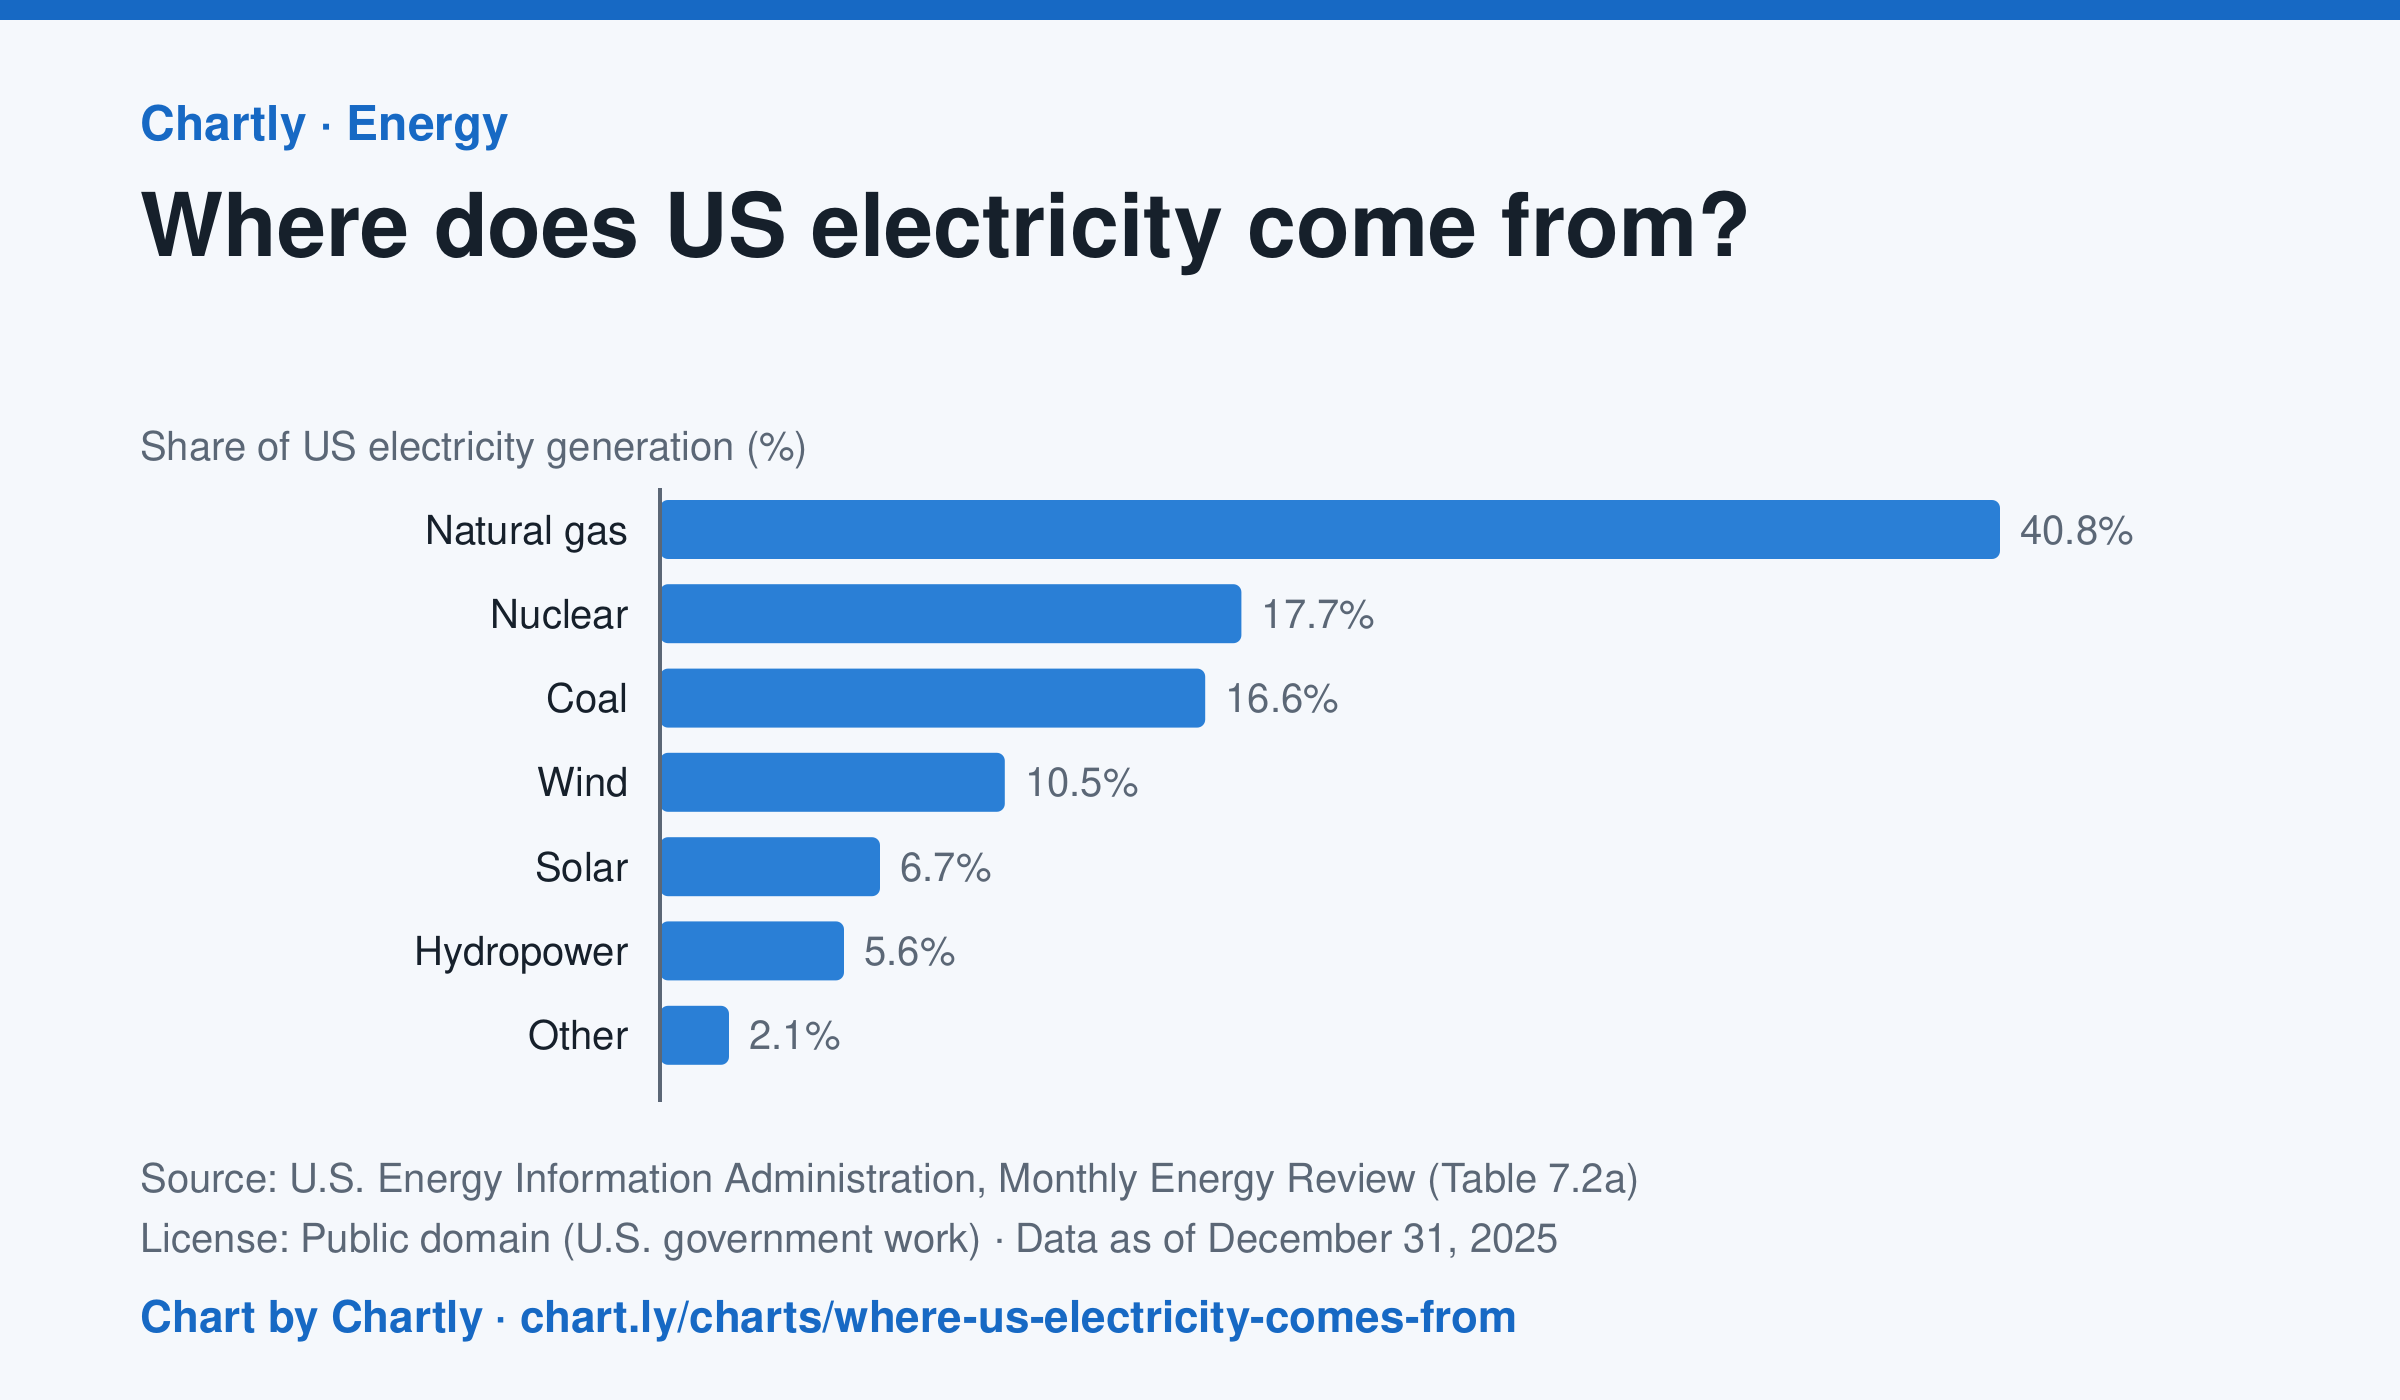
In 2025 natural gas made 40.8% of US electricity, followed by nuclear (17.7%) and coal (16.6%). Wind made 10.5% and solar 6.7%. Solar counts only utility-scale plants, not rooftop panels, and the 2025 figures are preliminary.
Source: U.S. Energy Information Administration, Monthly Energy Review (Table 7.2a) (Public domain (U.S. government work)) · Data as of Dec 31, 2025 · Open the interactive chart and its numbers
What students answer
How to read this chart
Each bar is one energy source's share of all the electricity made in the U.S. in a year, so the bars add up to about 100%. The bars start at zero, so a bar twice as long means twice the share. Solar counts only large power plants, not panels on rooftops.
Questions to discuss
- Which source makes the most electricity? About how many times more than the smallest bar?
- Which of these sources burn fuel and which don't? What share of electricity comes from each group?
- Why might a chart of this kind look different in your state than for the whole country?
The answer key gives the chart's key numbers (newest, highest, lowest, biggest change) and, for each question, the figures it asks about, written from the same data students see.
Or assign it online
Post this link in Google Classroom, Canvas or Moodle. Students see the interactive chart and the questions; they don't need an account.
A chart for class, every Monday
One fresh chart of public data, three questions to discuss and a link that opens it as a class assignment, in your inbox each Monday. Free, no account. See this week's.