Free printable worksheet · Health
Free drug overdose deaths chart worksheet with answer key
How many Americans die of drug overdoses each year? A one-page worksheet on a chart of trustworthy public data, with three questions and lines to write on, plus an answer key for you. Free, no account needed, and the numbers are the newest the source has published.
The chart on the worksheet
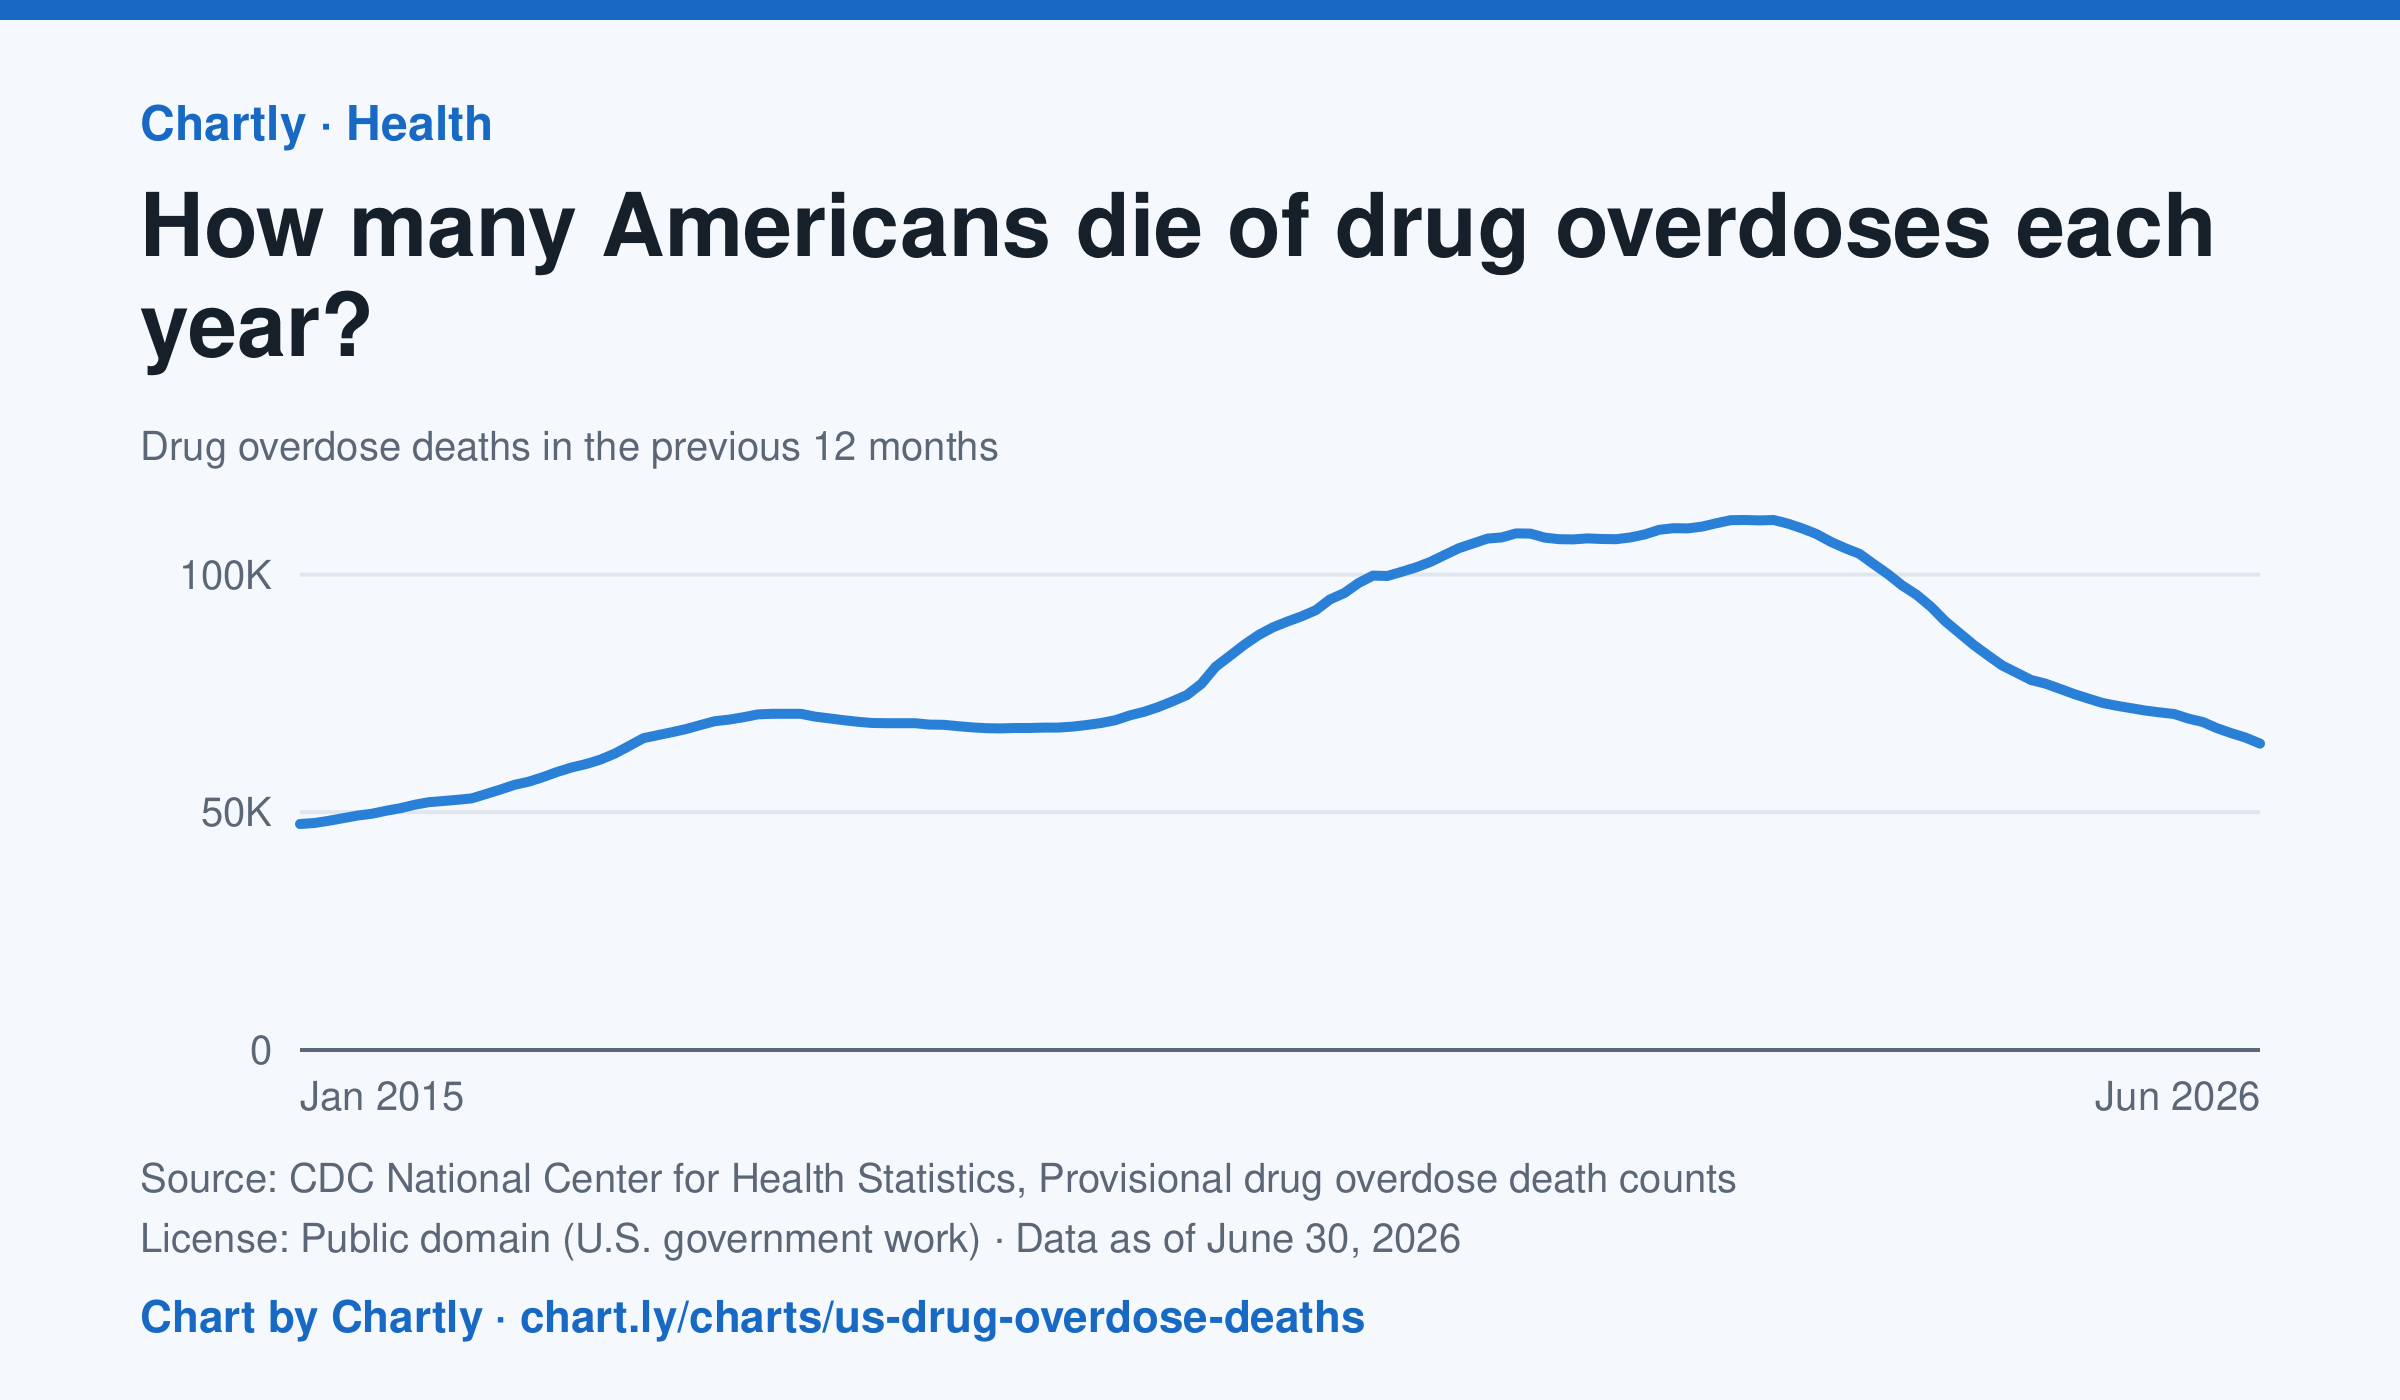
64,433 people died of drug overdoses in the US in the 12 months ending June 2026, about 42% fewer than at the peak of about 111,500 in the 12 months ending June 2023. The counts are provisional: the latest months are slightly undercounted while some causes of death are still being investigated. CDC's provisional counts start with the 12 months ending January 2015.
Source: CDC National Center for Health Statistics, Provisional drug overdose death counts (Public domain (U.S. government work)) · Data as of Jun 30, 2026 · Open the interactive chart and its numbers
What students answer
How to read this chart
Each point counts the people who died of a drug overdose in the 12 months ending that month, so each point covers a whole year. Using 12-month totals smooths out busy and quiet months. The newest months are provisional: the count rises as death investigations are finished.
Questions to discuss
- When were overdose deaths highest on the chart, and how has the number changed since then?
- Why does each point add up 12 months instead of showing just one month?
- Newer numbers can rise later as investigations finish. How should that change the way you read the newest points?
The answer key gives the chart's key numbers (newest, highest, lowest, biggest change) and, for each question, the figures it asks about, written from the same data students see.
Or assign it online
Post this link in Google Classroom, Canvas or Moodle. Students see the interactive chart and the questions; they don't need an account.
A chart for class, every Monday
One fresh chart of public data, three questions to discuss and a link that opens it as a class assignment, in your inbox each Monday. Free, no account. See this week's.