Free printable worksheet · Economics
Free wealth inequality chart worksheet with answer key
How is U.S. household wealth divided? A one-page worksheet on a chart of trustworthy public data, with three questions and lines to write on, plus an answer key for you. Free, no account needed, and the numbers are the newest the source has published.
The chart on the worksheet
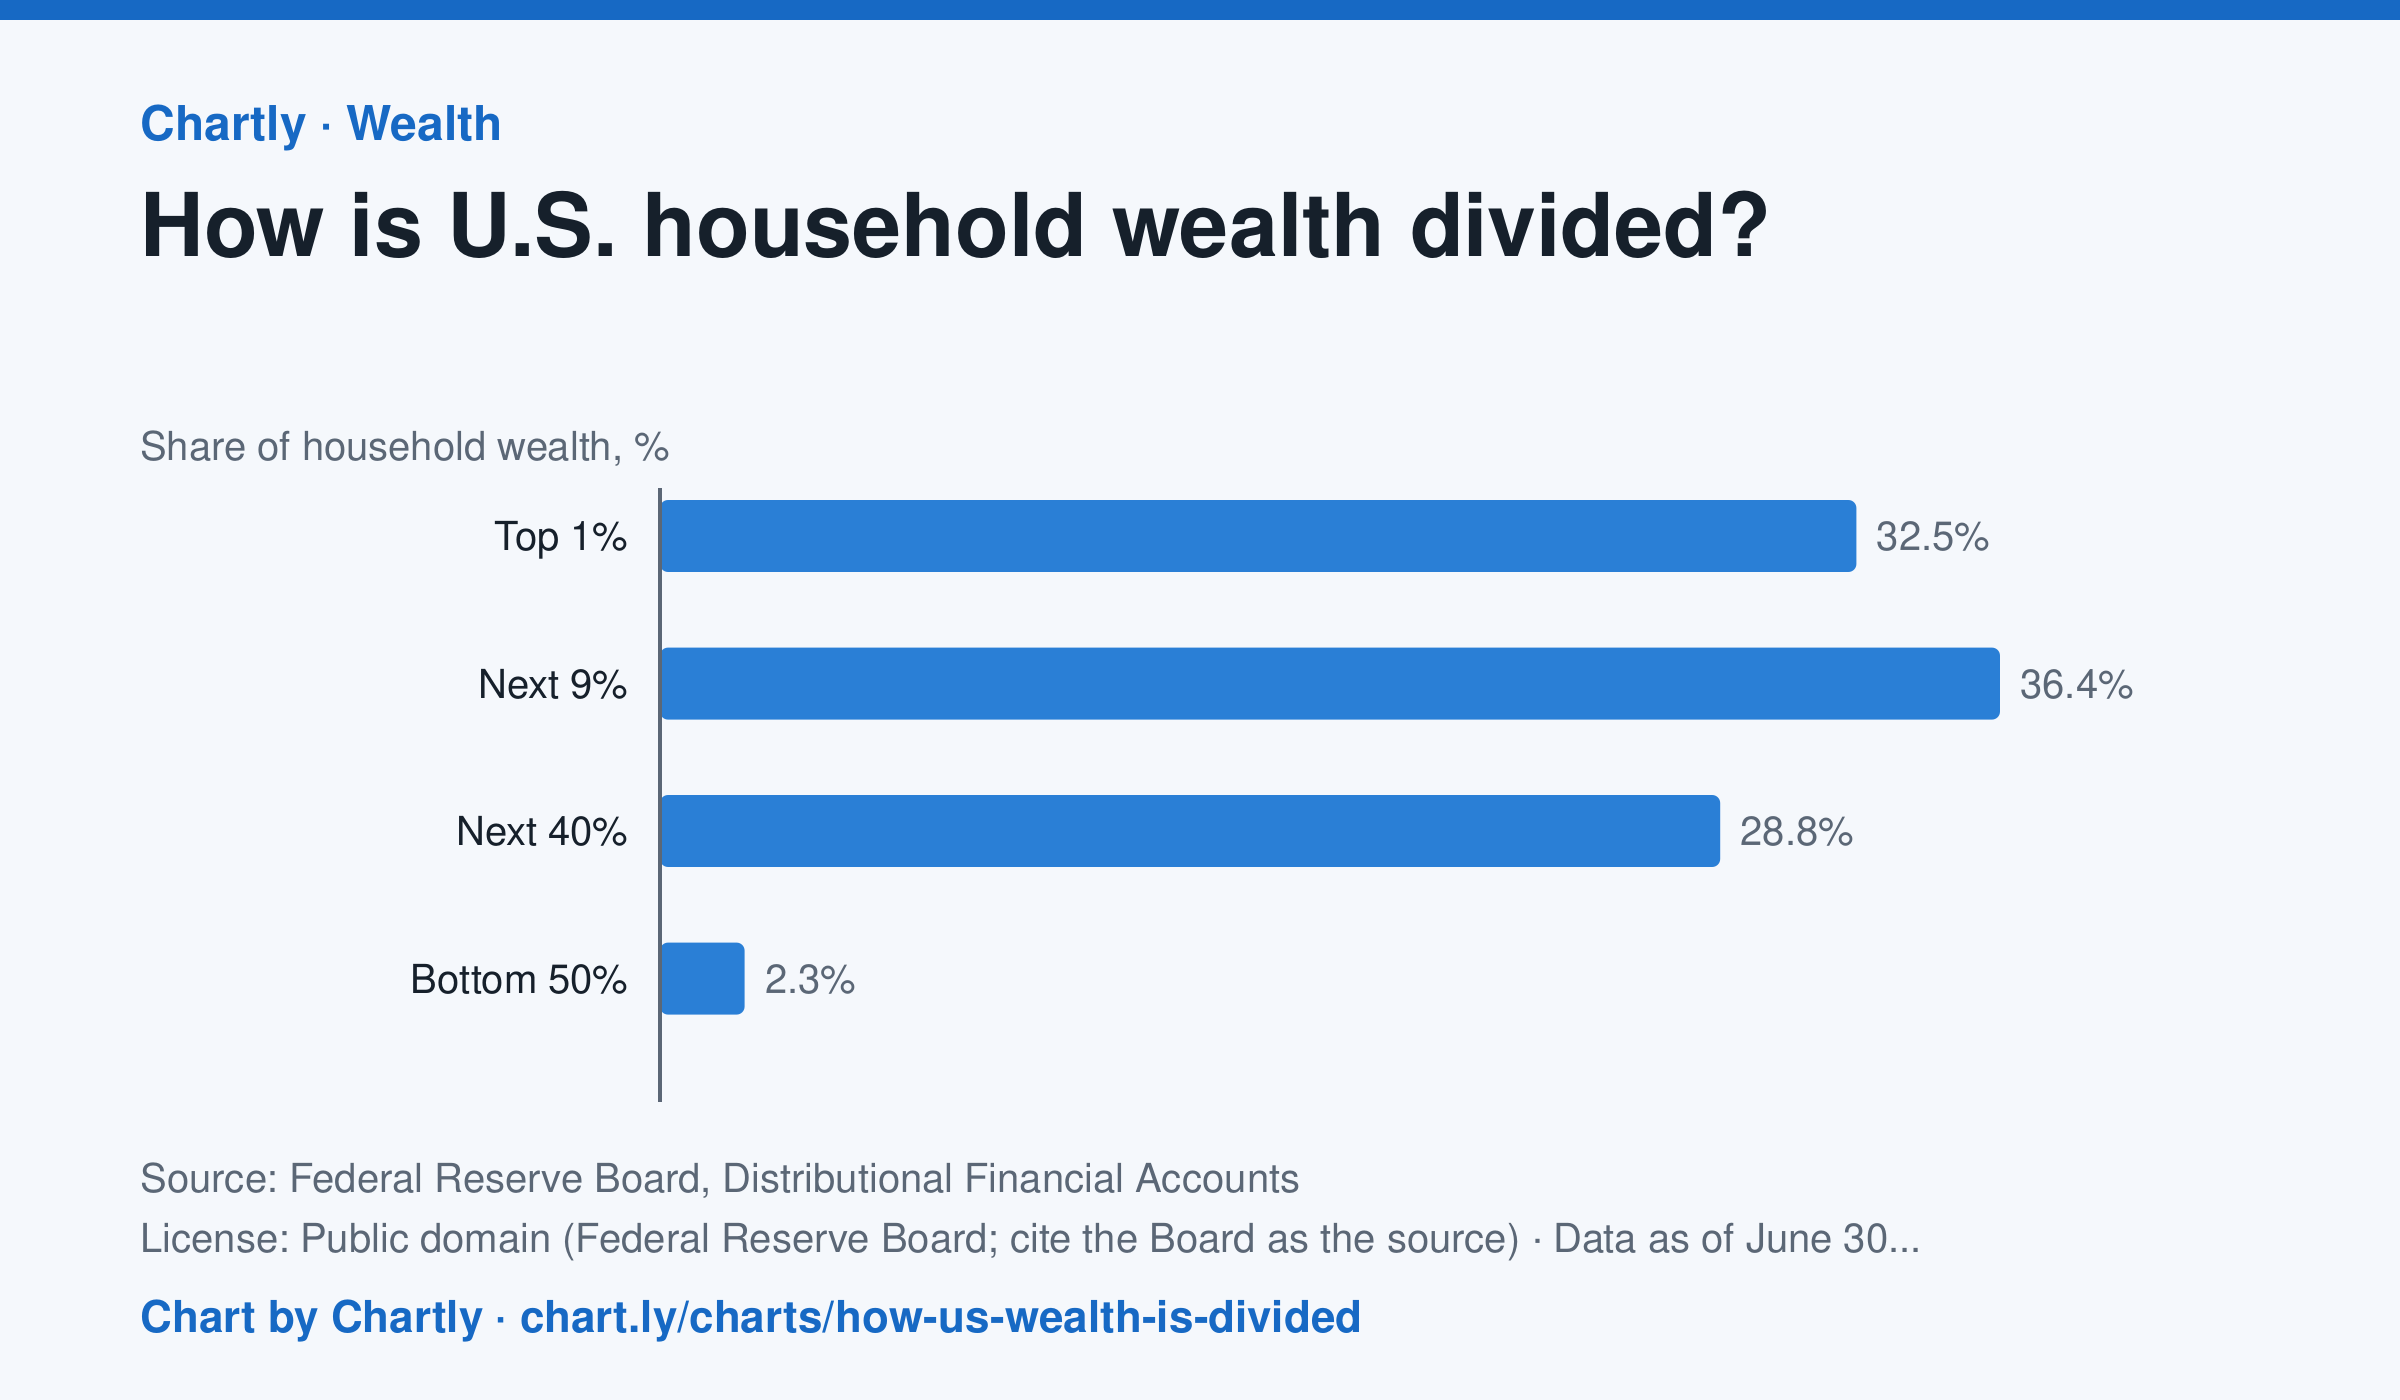
At the end of June 2026, the wealthiest 1% of U.S. households held 32.5% of all household wealth, the next 9% held 36.4%, the next 40% held 28.8% and the bottom 50% held 2.3%. In 1989 the shares were 22.8%, 38.0%, 35.7% and 3.5%. Wealth here is net worth: what households own (homes, stocks and mutual funds, pensions and retirement accounts, private businesses, cars and other belongings, bank deposits) minus what they owe (mortgages, credit cards, student and car loans). The Fed estimates each quarter by combining its Financial Accounts with its Survey of Consumer Finances, taken every three years, so the newest quarters are estimates that get revised.
Source: Federal Reserve Board, Distributional Financial Accounts (Public domain (Federal Reserve Board; cite the Board as the source)) · Data as of Jun 30, 2026 · Open the interactive chart and its numbers
What students answer
How to read this chart
Each bar is one group of U.S. households' share of all household wealth, so the four bars add up to 100%. The groups are different sizes: the top 1% is one household in every hundred, while the bottom 50% is half of all households. Compare each group's share of wealth with its share of households.
Questions to discuss
- Which group holds the largest share of wealth? Is it the group with the most households?
- If wealth were split evenly, what share would the bottom 50% hold? How far is the chart from that?
- The takeaway gives the 1989 shares too. Which groups gained a share since then, and which lost one?
The answer key gives the chart's key numbers (newest, highest, lowest, biggest change) and, for each question, the figures it asks about, written from the same data students see.
Or assign it online
Post this link in Google Classroom, Canvas or Moodle. Students see the interactive chart and the questions; they don't need an account.
A chart for class, every Monday
One fresh chart of public data, three questions to discuss and a link that opens it as a class assignment, in your inbox each Monday. Free, no account. See this week's.