Free printable worksheet · Geography
Free GDP per person chart worksheet with answer key
How rich is each country, per person? A one-page worksheet on a chart of trustworthy public data, with three questions and lines to write on, plus an answer key for you. Free, no account needed, and the numbers are the newest the source has published.
The chart on the worksheet
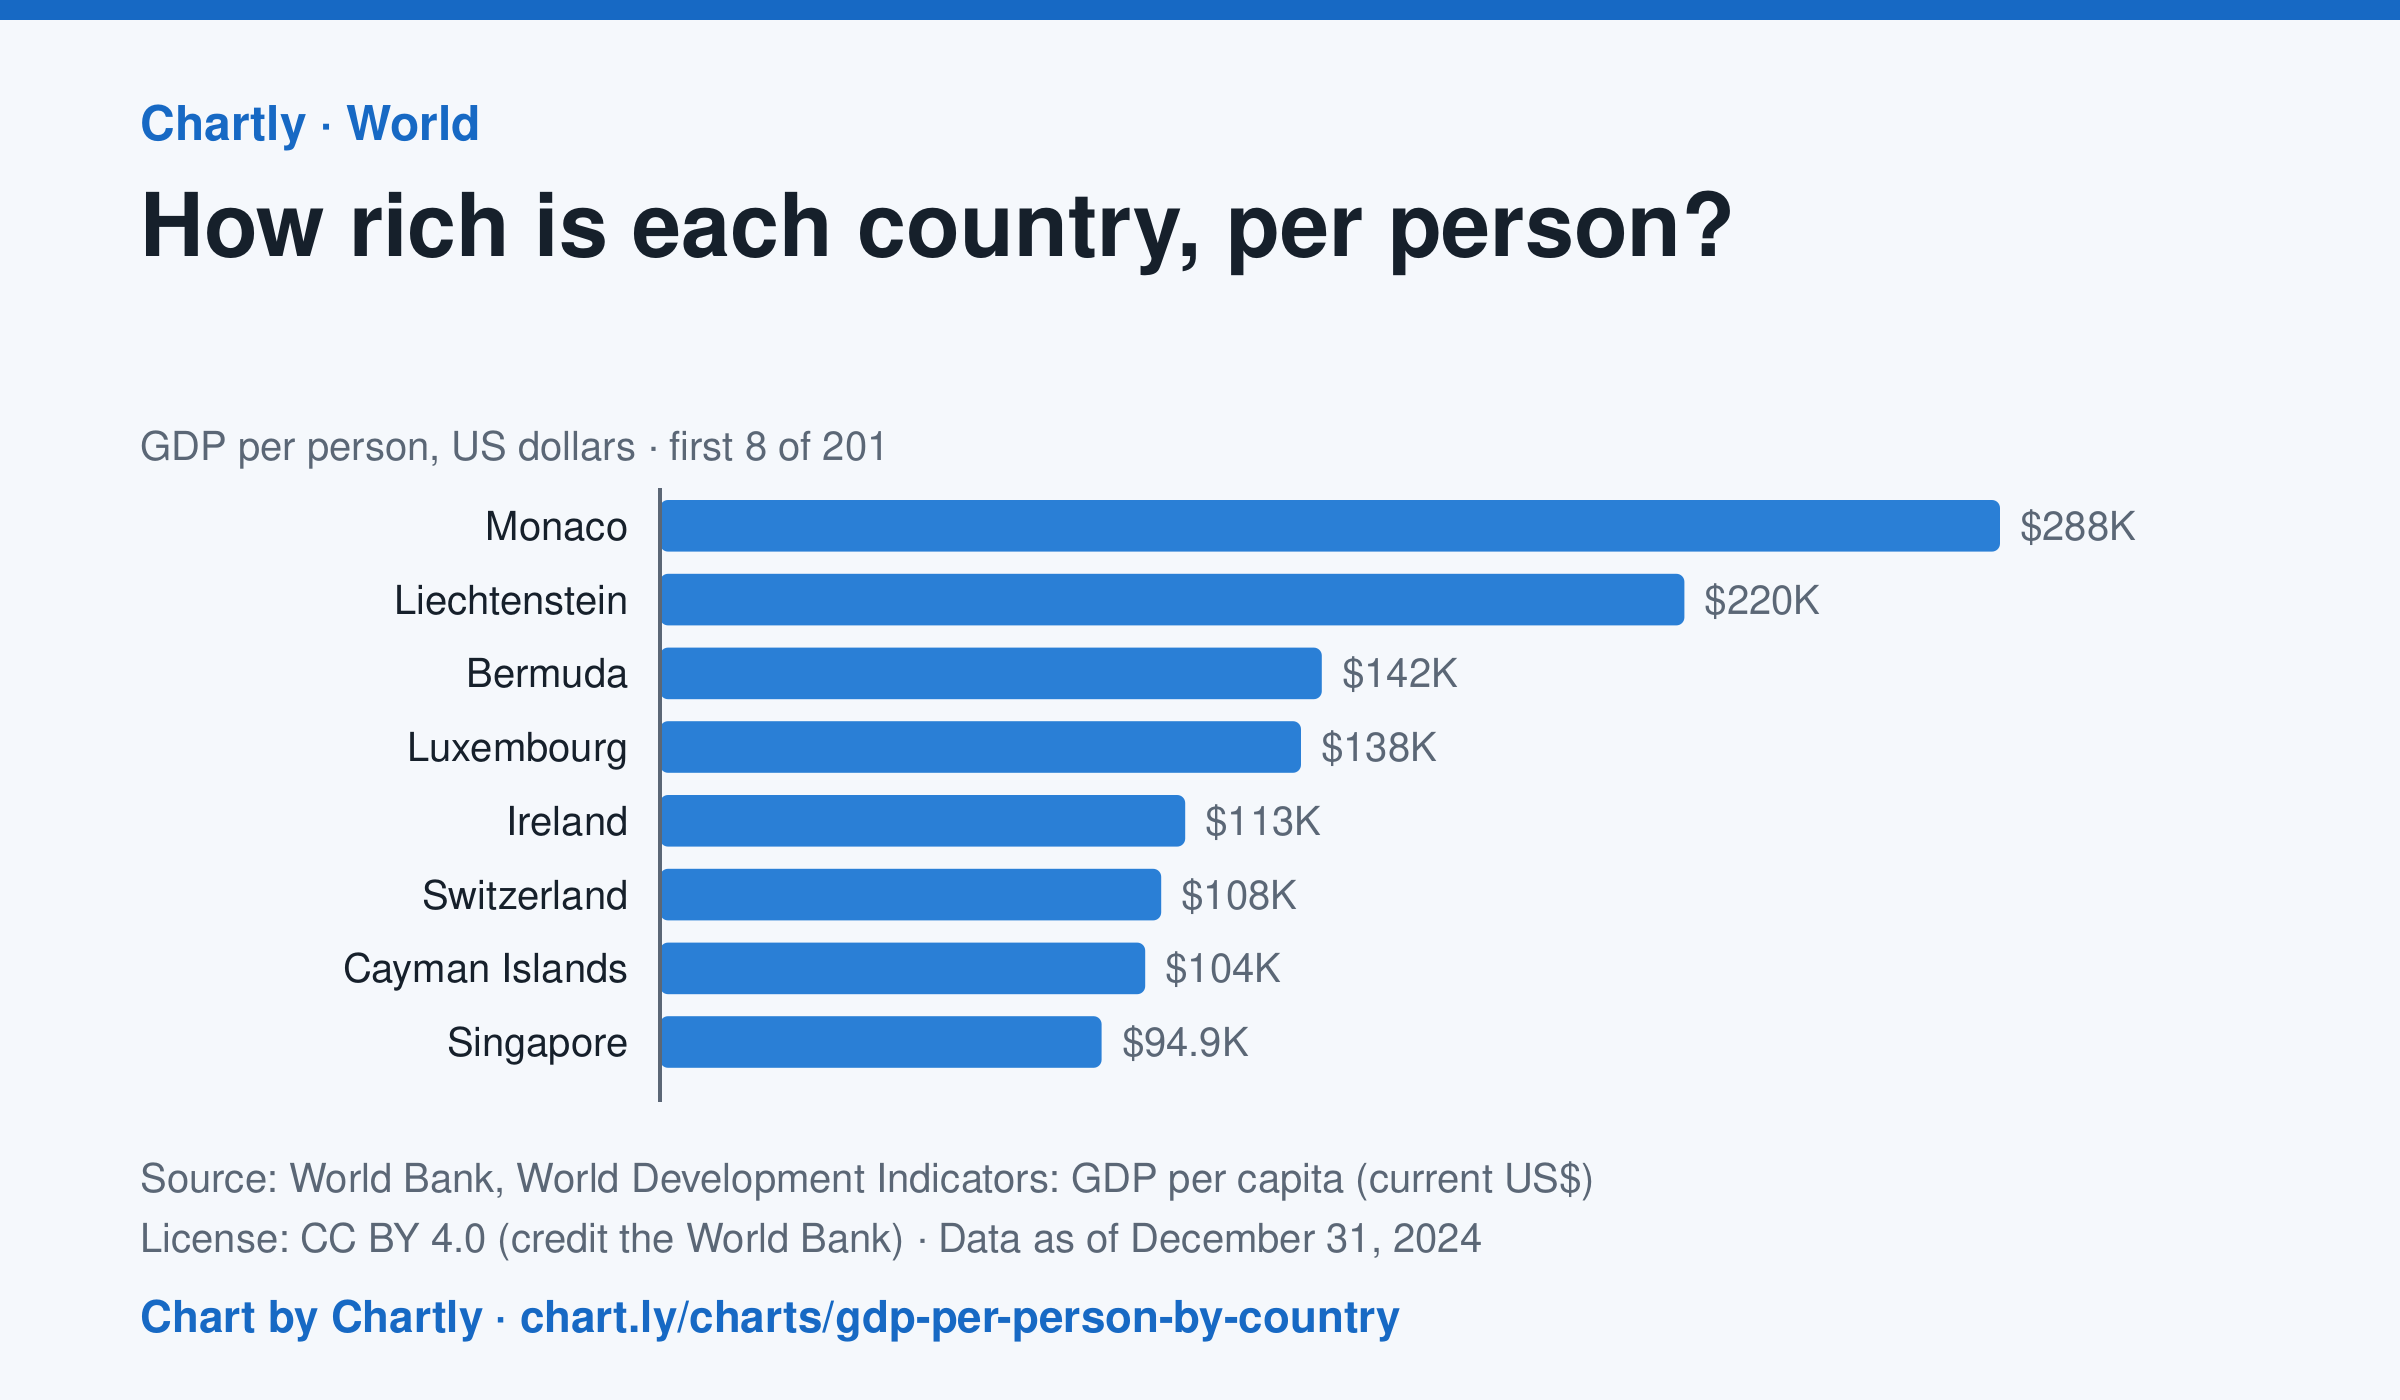
In 2024, Monaco produced the most goods and services (GDP) per person, $288,002, and Burundi the least, $216; the United States was at $86,170, China at $13,293 and India at $2,592. Search 200 countries and territories. Figures are in US dollars at each year's exchange rates, not adjusted for differences in prices, and places that hadn't reported 2024 are left out.
Source: World Bank, World Development Indicators: GDP per capita (current US$) (CC BY 4.0 (credit the World Bank)) · Data as of Dec 31, 2024 · Open the interactive chart and its numbers
What students answer
How to read this chart
Each bar is a country's GDP, the value of everything it produces in a year, divided by its number of people, in U.S. dollars. The dashed line is the world figure. On a phone the chart opens on the top and bottom 10; search for any country. It measures an average, not what a typical person earns.
Questions to discuss
- Which countries are at the top and bottom? How many times bigger is the top country's figure than the bottom one?
- Find your country, or one you have visited. Is it above or below the world line?
- Why might a small country with a few big banks or oil fields rank higher than a large country with many workers?
The answer key gives the chart's key numbers (newest, highest, lowest, biggest change) and, for each question, the figures it asks about, written from the same data students see.
Or assign it online
Post this link in Google Classroom, Canvas or Moodle. Students see the interactive chart and the questions; they don't need an account.
A chart for class, every Monday
One fresh chart of public data, three questions to discuss and a link that opens it as a class assignment, in your inbox each Monday. Free, no account. See this week's.