Free printable worksheet · Economics
Free unemployment by country chart worksheet with answer key
What is the unemployment rate in each country? A one-page worksheet on a chart of trustworthy public data, with three questions and lines to write on, plus an answer key for you. Free, no account needed, and the numbers are the newest the source has published.
The chart on the worksheet
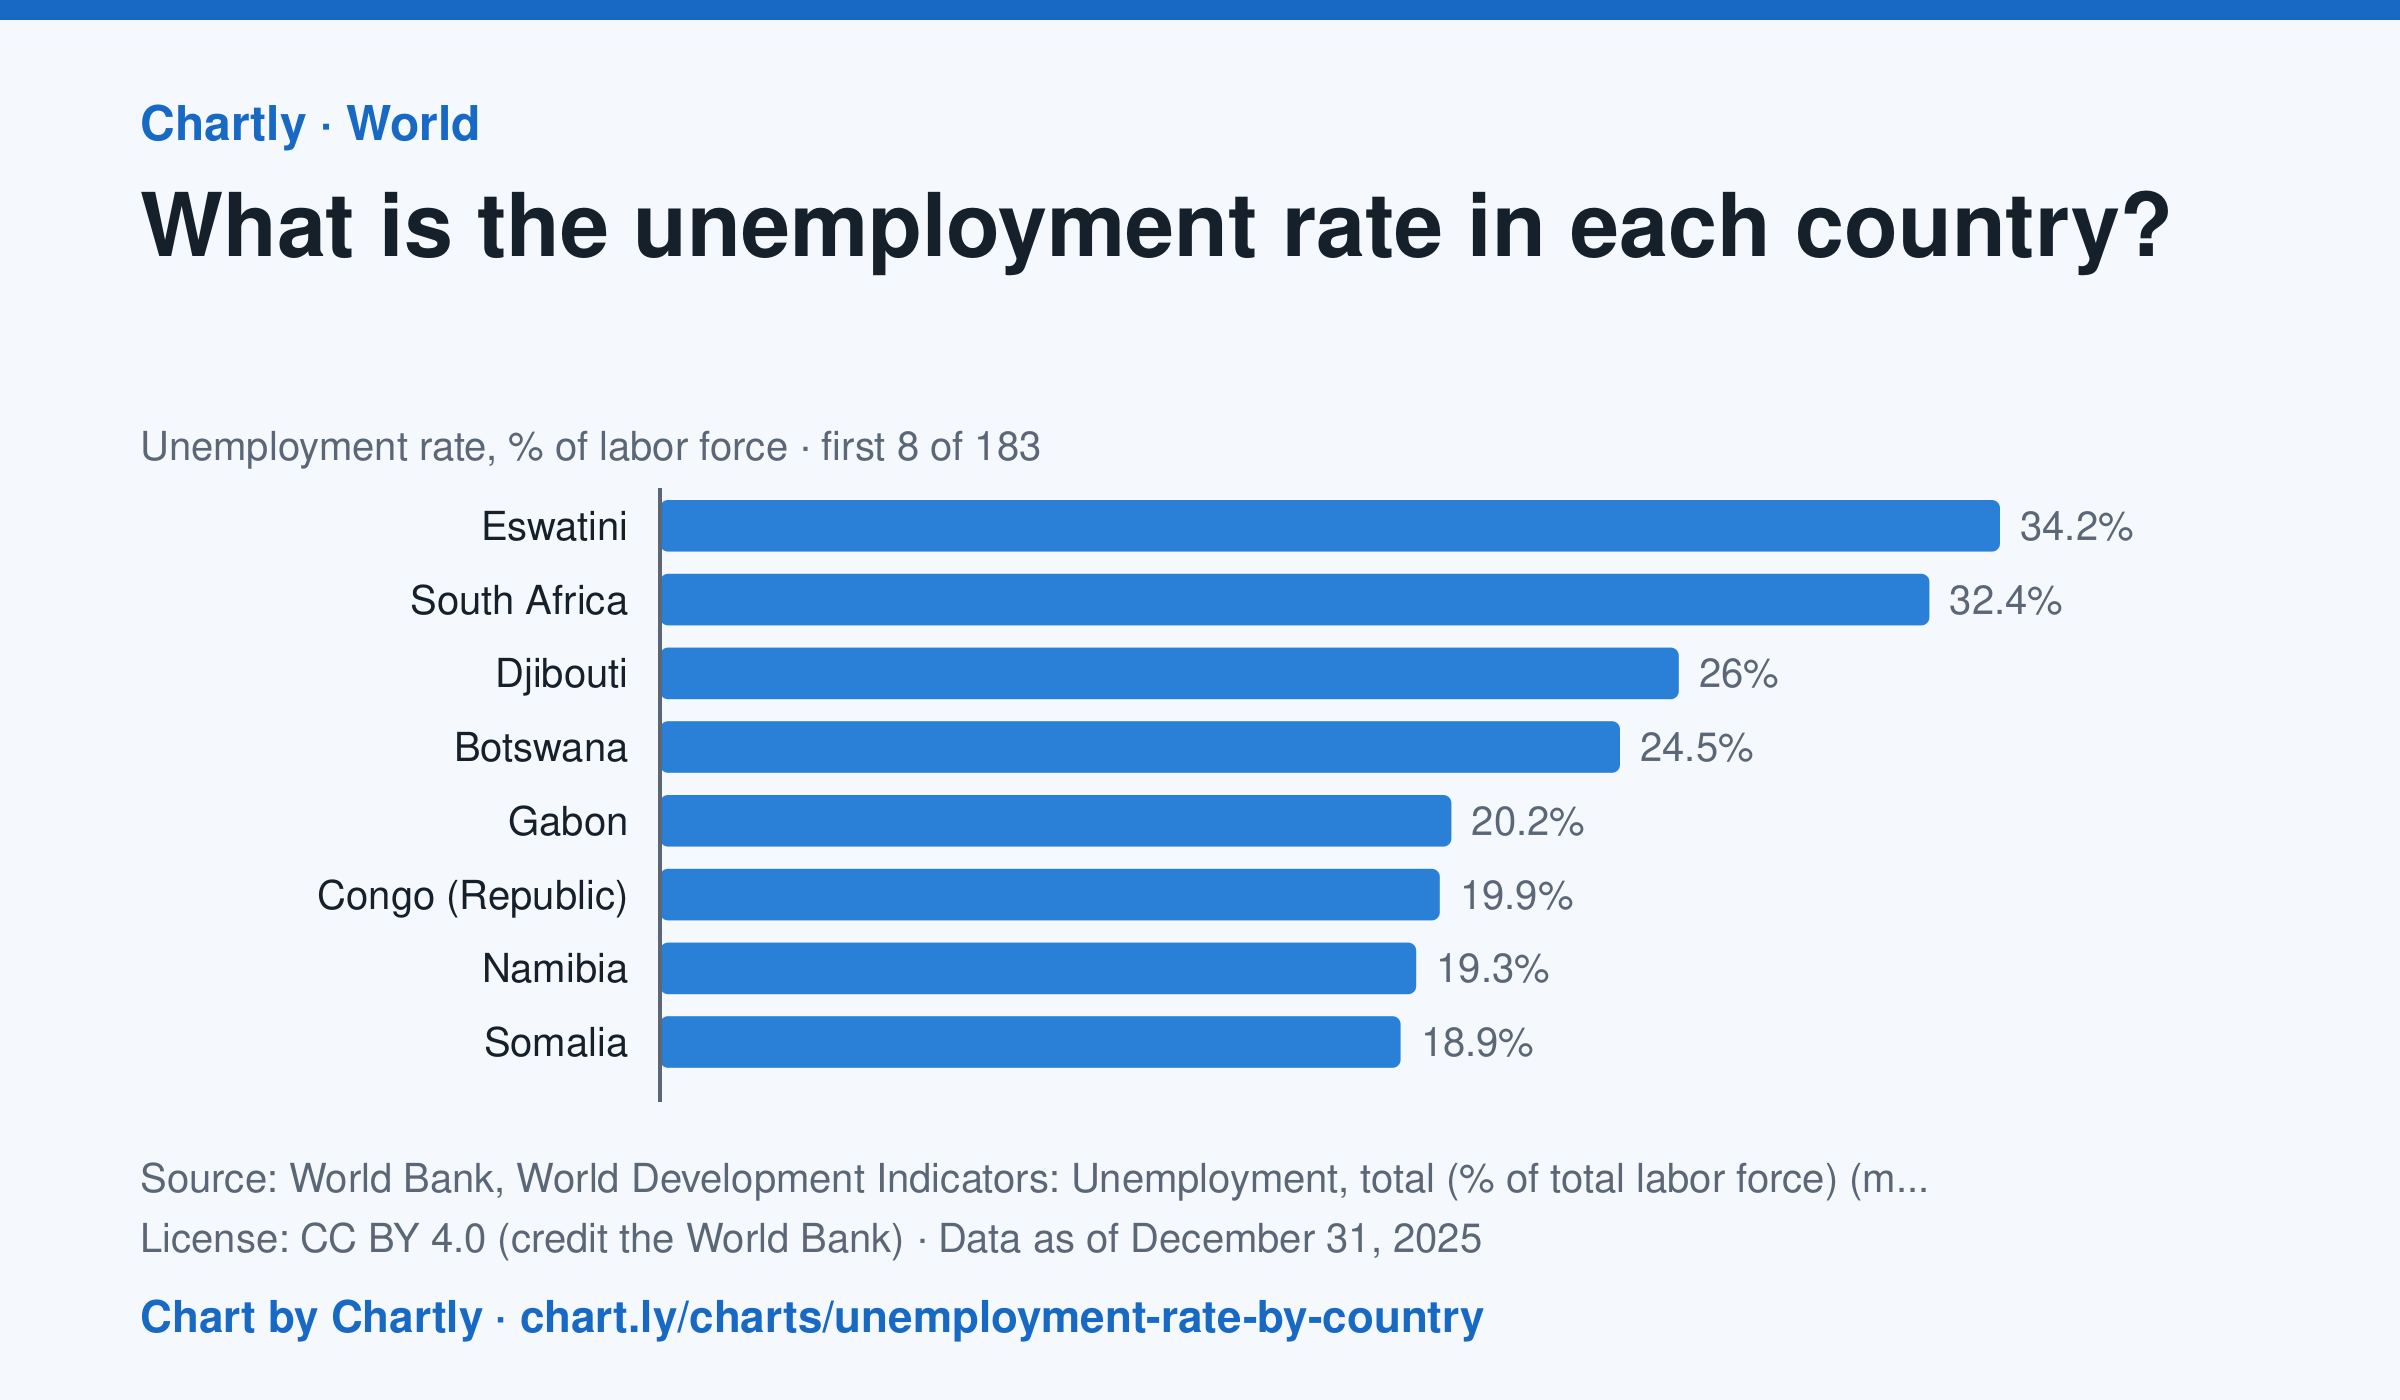
In 2025, 4.2% of workers in the United States were unemployed, against 4.8% worldwide; the highest rate was 34.2% in Eswatini, and the lowest 0.1%, in Qatar. Search 182 countries and territories. These are the International Labour Organization's estimates, which count people without work who are looking for it and fill gaps where a country runs no regular survey, so they can differ from a country's own figures.
Source: World Bank, World Development Indicators: Unemployment, total (% of total labor force) (modeled ILO estimate) (CC BY 4.0 (credit the World Bank)) · Data as of Dec 31, 2025 · Open the interactive chart and its numbers
What students answer
How to read this chart
Each bar is the share of a country's workers who have no job and are looking for one, estimated by the International Labour Organization. The dashed line is the world. People who aren't looking for work, such as students and retirees, aren't counted as unemployed at all.
Questions to discuss
- Is the United States above or below the world rate, and by about how many percentage points?
- A country can have low unemployment while many people earn very little. How is that possible?
- Why would someone who has given up looking for work not count as unemployed? Does that make the number more or less useful?
The answer key gives the chart's key numbers (newest, highest, lowest, biggest change) and, for each question, the figures it asks about, written from the same data students see.
Or assign it online
Post this link in Google Classroom, Canvas or Moodle. Students see the interactive chart and the questions; they don't need an account.
A chart for class, every Monday
One fresh chart of public data, three questions to discuss and a link that opens it as a class assignment, in your inbox each Monday. Free, no account. See this week's.