The teacher's answer key. Students' scales may differ; any even scale that starts at 0 and fits the biggest number is right.
Answer key · graphing practice
Draw a bar graph: unemployment by country
A title such as "What is the unemployment rate in each country?". Bottom axis: Country. Side axis: Unemployment rate, % of labor force, from 0 to 50, going up by 5 on each dark line.
| Country | Unemployment rate, % of labor force |
|---|---|
| Eswatini | 34.2 |
| South Africa | 32.4 |
| Djibouti | 26 |
| Botswana | 24.5 |
| Gabon | 20.2 |
| Congo (Republic) | 19.9 |
| Namibia | 19.3 |
| Somalia | 18.9 |
| Libya | 18.8 |
| St. Vincent and the Grenadines | 18 |
The 10 highest of the 182 on the chart. Numbers are rounded to make them easier to plot. Source: World Bank, World Development Indicators: Unemployment, total (% of total labor force) (modeled ILO estimate) (CC BY 4.0 (credit the World Bank)) · Data as of Dec 31, 2025
The finished Chartly chart
Every number the source has, not only the table's rows.
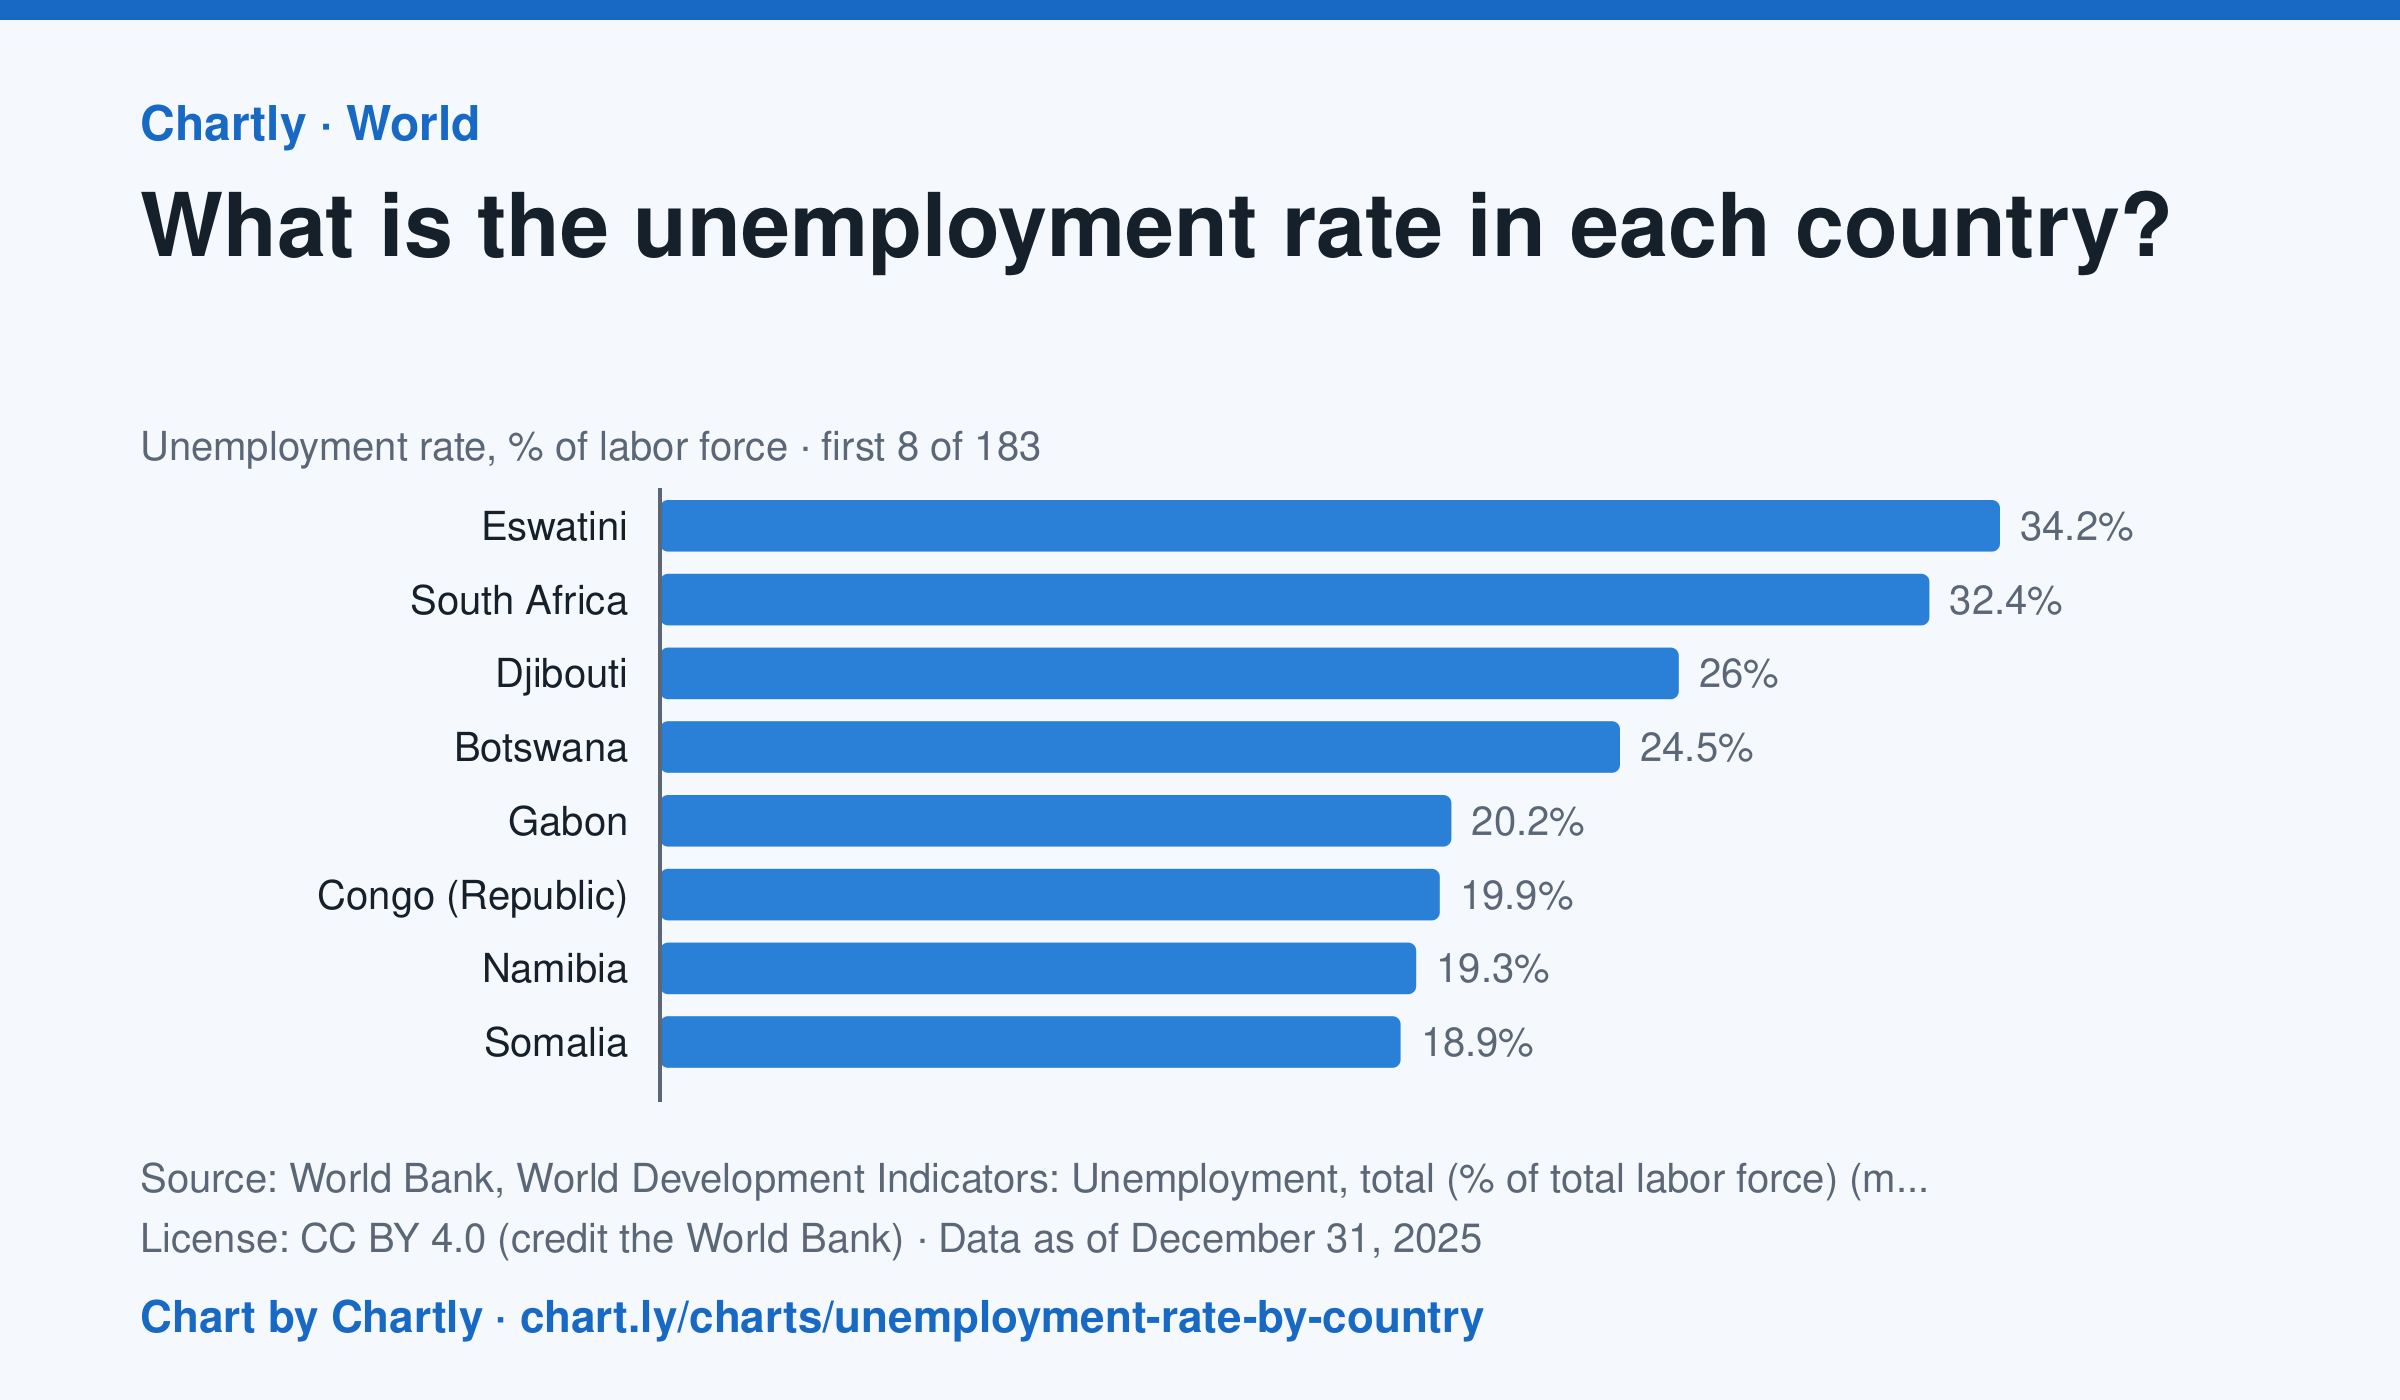
In 2025, 4.2% of workers in the United States were unemployed, against 4.8% worldwide; the highest rate was 34.2% in Eswatini, and the lowest 0.1%, in Qatar. Search 182 countries and territories. These are the International Labour Organization's estimates, which count people without work who are looking for it and fill gaps where a country runs no regular survey, so they can differ from a country's own figures.
Chart and numbers: chart.ly/charts/unemployment-rate-by-country · Source: World Bank, World Development Indicators: Unemployment, total (% of total labor force) (modeled ILO estimate) (CC BY 4.0 (credit the World Bank)) · Data as of Dec 31, 2025