Print this worksheet, or choose "Save as PDF" in the print window to share a file.
Chart worksheet
Charts to read and discuss
Name:
Class:
Date:
Chart 1 of 1 · Health
How has the US teen birth rate changed since 1940?
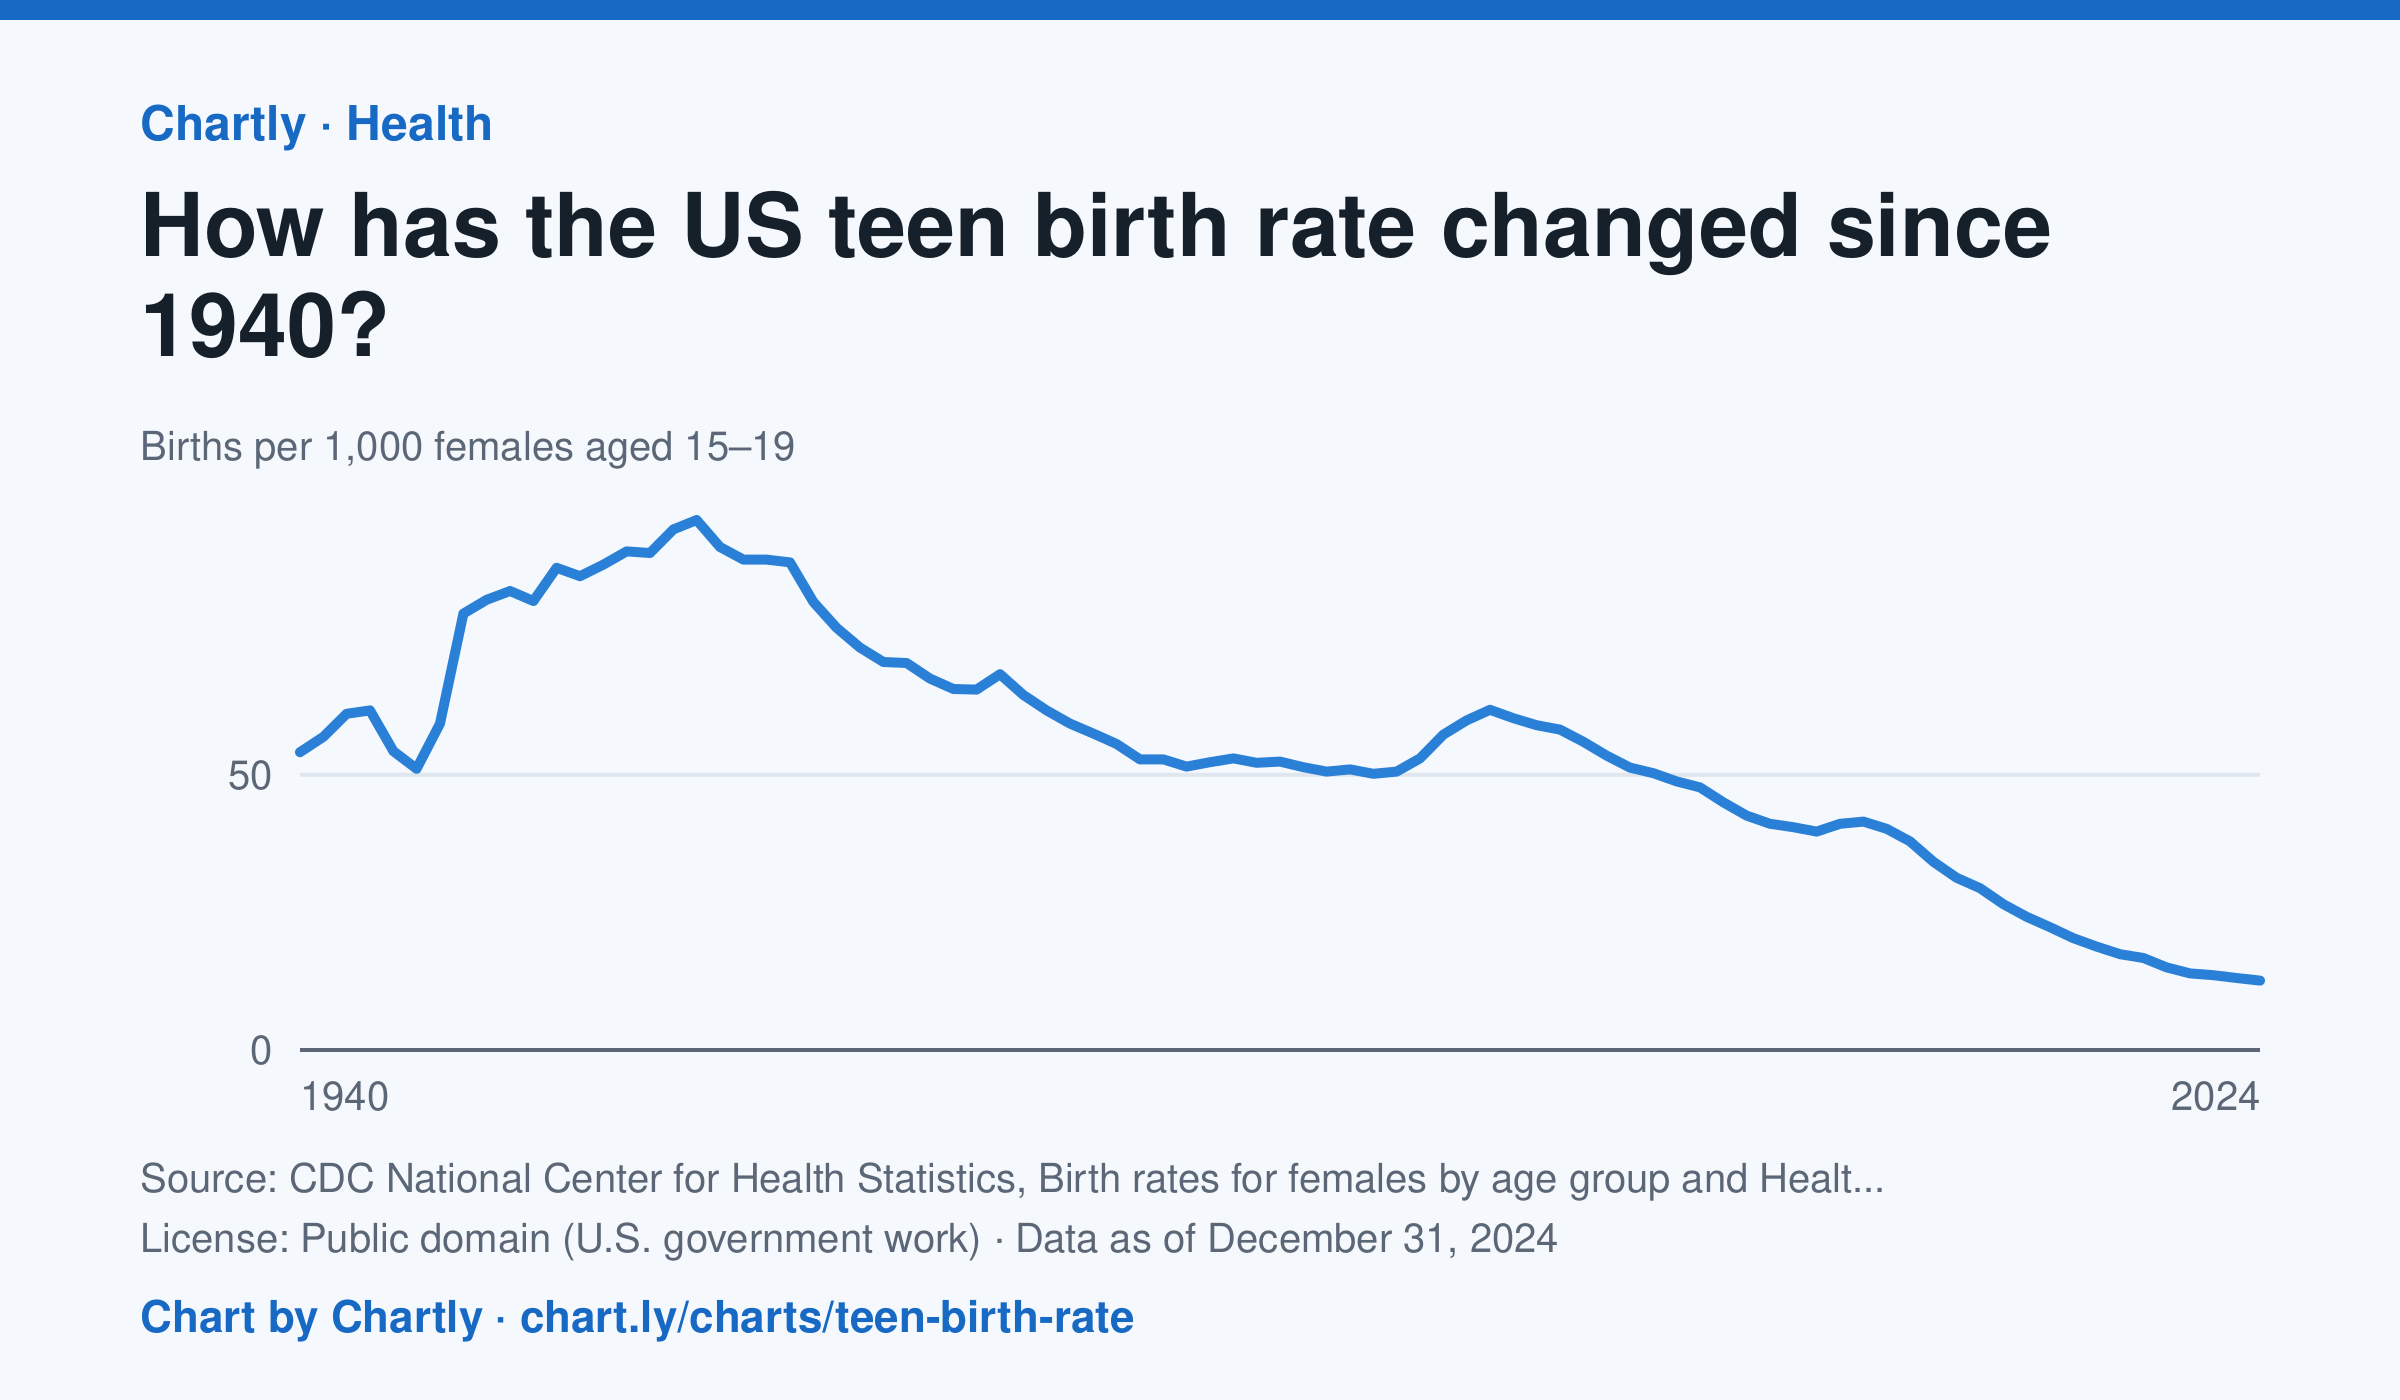
There were 12.6 births per 1,000 females aged 15 to 19 in 2024. The rate has fallen about 80% since 1991 (61.8) and about 87% since its 1957 peak (96.3).
Source: CDC National Center for Health Statistics, Birth rates for females by age group and Health, United States (Public domain (U.S. government work)) · Data as of Dec 31, 2024
How to read this chart
Each point is how many babies were born in a year for every 1,000 young women aged 15 to 19. A rate is used instead of a count so that years with more or fewer teenagers can be compared fairly. Hover or tap a point to read its year and value.
Questions
- When was the teen birth rate highest, and what is it in the newest year?
- Showing your work, by about what percent has the rate fallen since its peak?
- What changes in schools, health care or society could explain the long fall since the early 1990s?
Chart and numbers: chart.ly/charts/teen-birth-rate · More free charts at chart.ly