The teacher's answer key. Students' scales may differ; any even scale that starts at 0 and fits the biggest number is right.
Answer key · graphing practice
Draw a bar graph: carbon emissions by country
A title such as "How much carbon dioxide does each country emit per person?". Bottom axis: Country. Side axis: Carbon dioxide emissions, tonnes per person, from 0 to 100, going up by 10 on each dark line.
| Country | Carbon dioxide emissions, tonnes per person |
|---|---|
| Palau | 82.8 |
| Qatar | 47.3 |
| Bahrain | 23.9 |
| Kuwait | 23.7 |
| Brunei | 20.2 |
| Trinidad and Tobago | 19.6 |
| Oman | 18.7 |
| Saudi Arabia | 18.5 |
| United Arab Emirates | 18.3 |
| New Caledonia | 17.1 |
The 10 highest of the 203 on the chart. Numbers are rounded to make them easier to plot. Source: World Bank, World Development Indicators: Carbon dioxide (CO2) emissions excluding LULUCF per capita (t CO2e/capita) (CC BY 4.0 (credit the World Bank)) · Data as of Dec 31, 2024
The finished Chartly chart
Every number the source has, not only the table's rows.
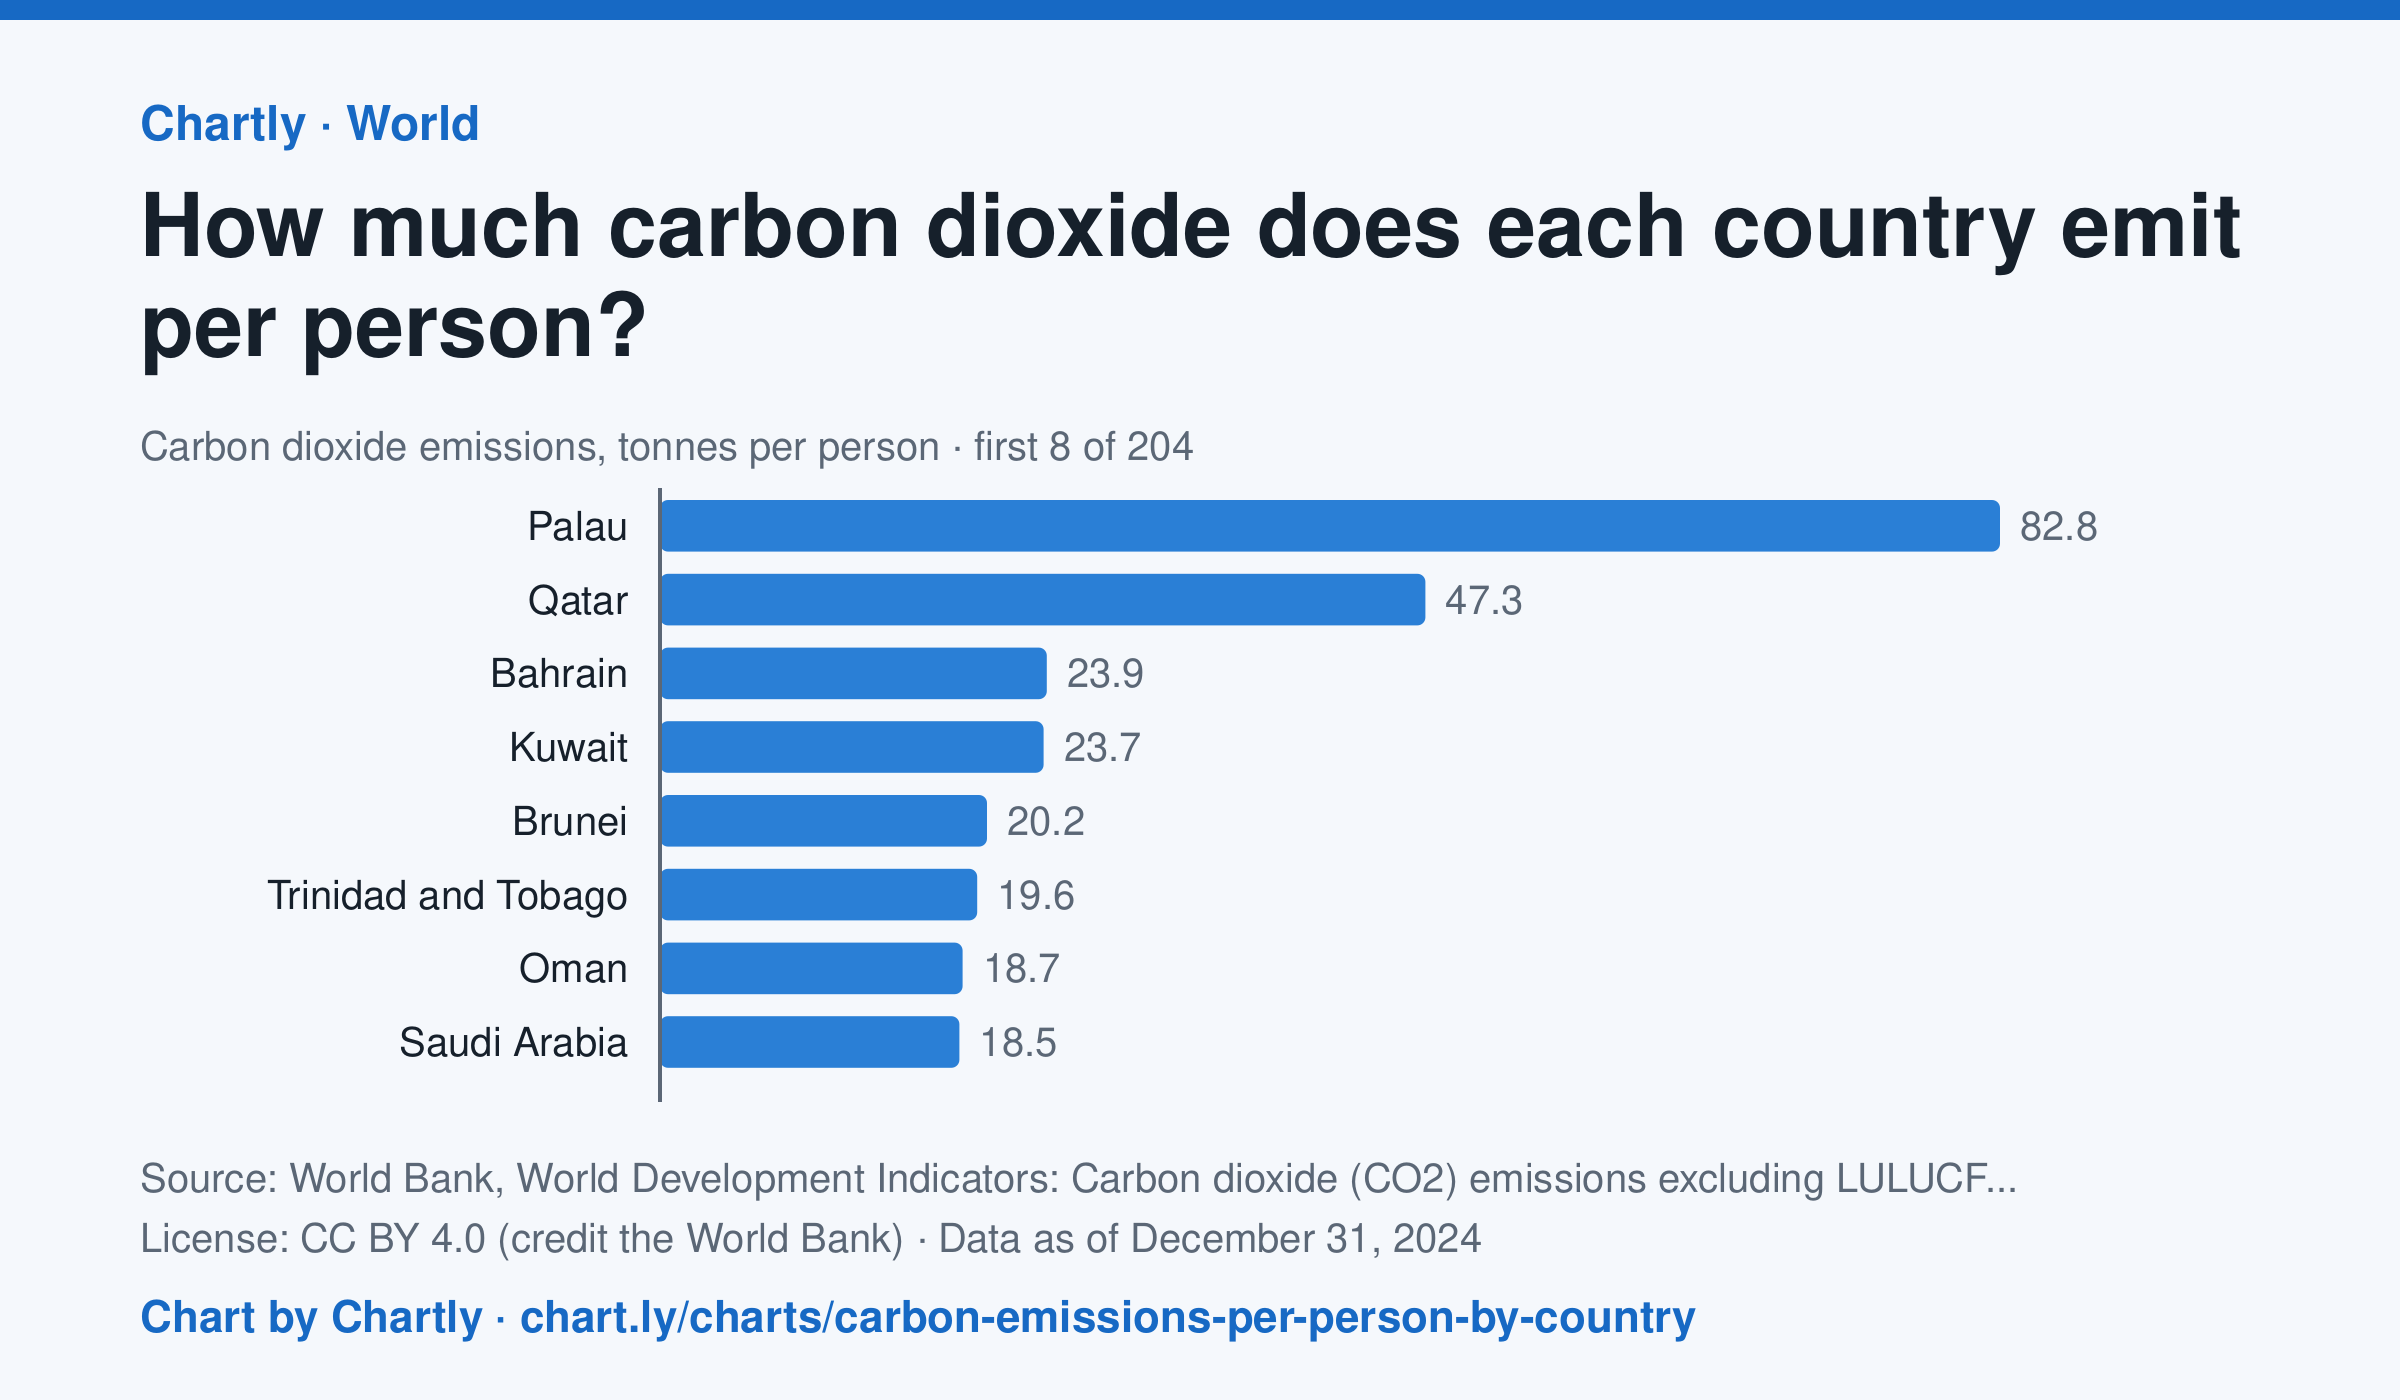
In 2024, people in the United States emitted 13.6 tonnes of carbon dioxide each, in China 9.3 and in India 2.2, against 4.7 worldwide. The highest figure was 82.8 tonnes in Palau, then Qatar (47.3) and Bahrain (23.9). Search 203 countries and territories. The figures count carbon dioxide from burning fuel, industry and other sources, but not from changes in land use such as cutting forests; in a small country, a few power plants, refineries or fuel sales spread over few people can make the figure very high.
Chart and numbers: chart.ly/charts/carbon-emissions-per-person-by-country · Source: World Bank, World Development Indicators: Carbon dioxide (CO2) emissions excluding LULUCF per capita (t CO2e/capita) (CC BY 4.0 (credit the World Bank)) · Data as of Dec 31, 2024