Which U.S. cities of 100,000 or more have the highest murder rates?
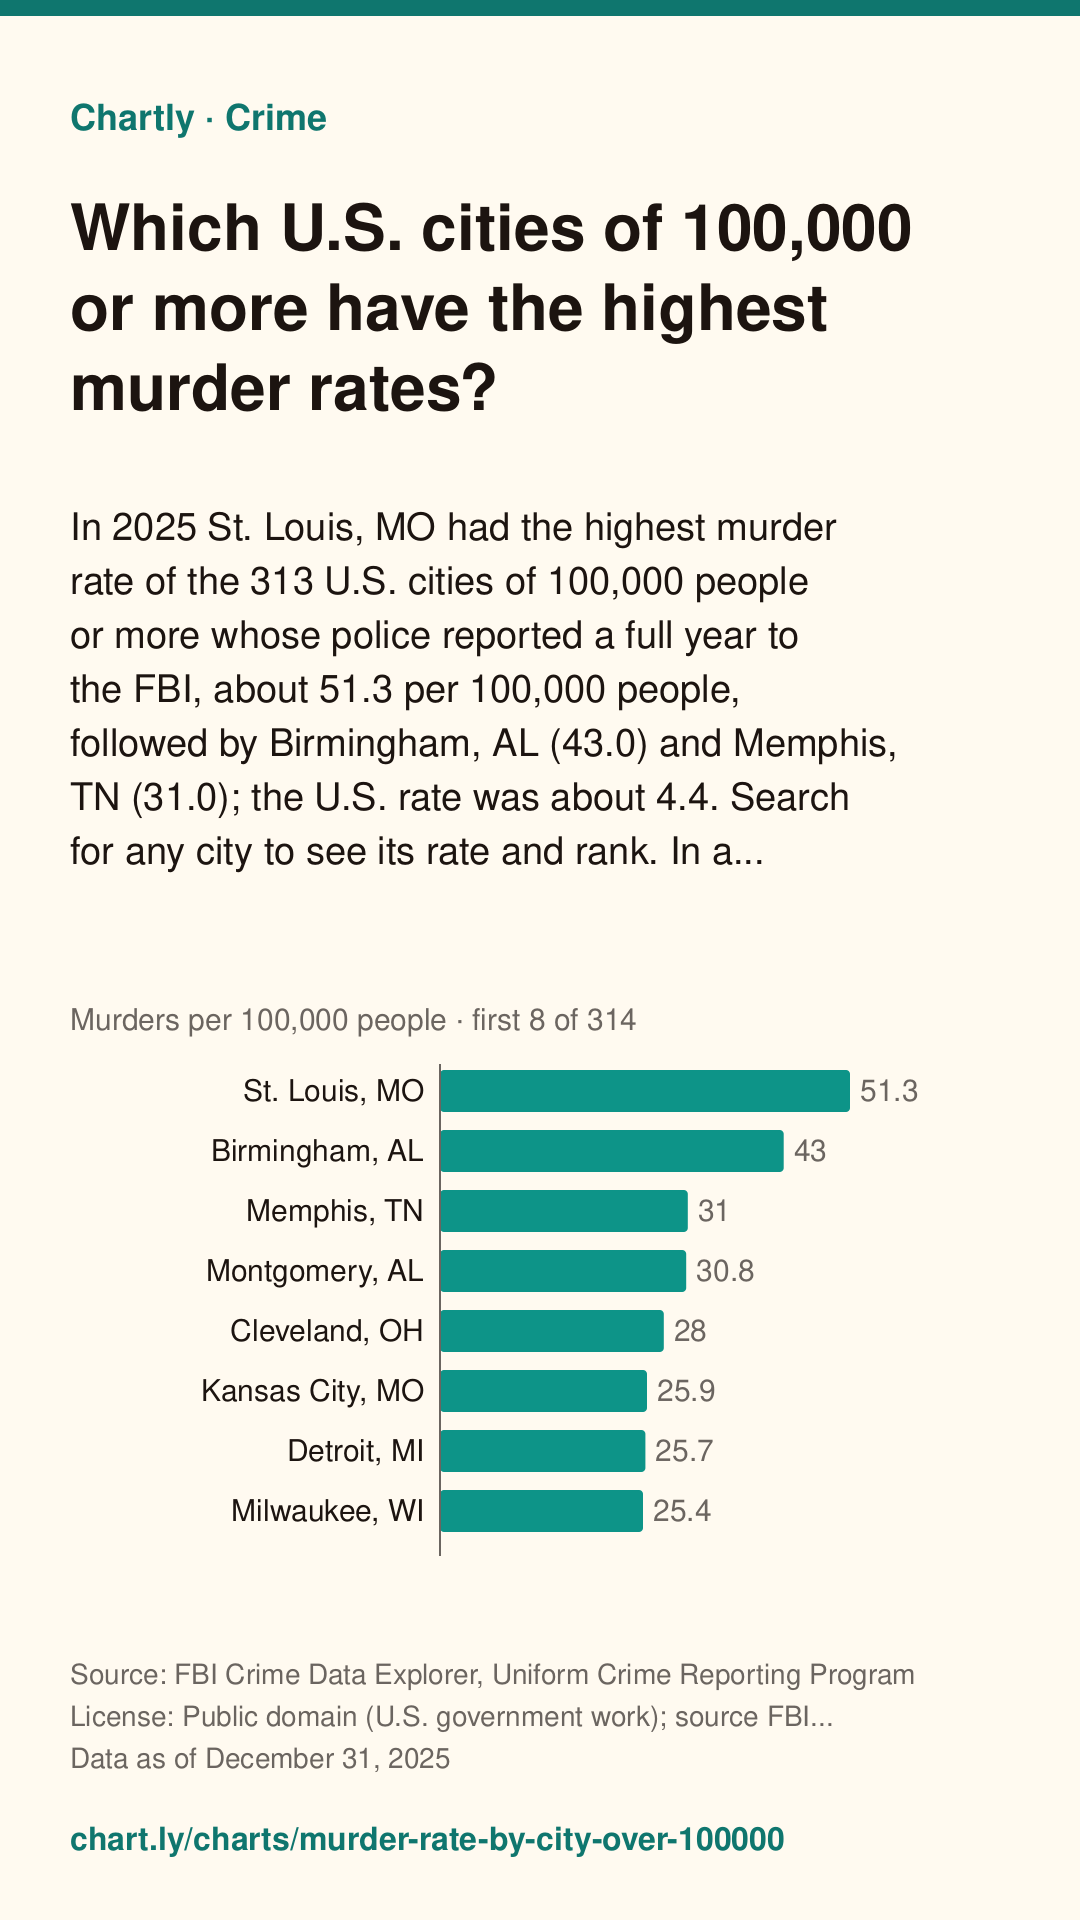
In 2025 St. Louis, MO had the highest murder rate of the 313 U.S. cities of 100,000 people or more whose police reported a full year to the FBI, about 51.3 per 100,000 people, followed by Birmingham, AL (43.0) and Memphis, TN (31.0); the U.S. rate was about 4.4. Search for any city to see its rate and rank. In a city of 100,000, one more or one fewer murder moves the rate by 1, so a smaller city's rate can jump from year to year. Departments that didn't report a full year are left out, and each rate is per person the department serves; a few serve their whole county. A city's rate also depends on where its borders fall, so compare cities with care.
The interactive chart needs JavaScript. The numbers are in the table below.
Bars are sorted from highest to lowest and start at zero; each one's value is at its end. The dashed line is “U.S. overall”, for comparison. It opens on the top and bottom 10; use “Show all” or the search box for the rest.
Save a simple drawing of this chart for slides, essays or posts, with its question, source, date and a link back to this page. Please keep the credit.
Download image
A tall picture for Pinterest or an Instagram story, with the question, answer, source, date and this page's address.
Chartly Pro: downloads and embeds without the credit. Join the waitlist
It doesn't exist yet. Tell us what you'd use it for, and we'll email you once when it's ready. Downloads and embeds with the credit stay free.
Key facts
Measure: Murders per 100,000 people. Written from the data below.
- St. Louis, MO has the highest figure, 51.3, followed by Birmingham, AL (43) and Memphis, TN (31).
- Vacaville, CA, Santa Clara, CA, San Mateo, CA, Overland Park, KS, and 9 more share the lowest figure, 0.
- U.S. overall: 4.4. Of the 313 compared, 136 are above it, 173 below, and 4 the same.
Teachers: add this chart to a class assignment, one link to post in Google Classroom, Canvas or Moodle.
Source and date
- Data as of
- Published
Citation
Chartly. “Which U.S. cities of 100,000 or more have the highest murder rates?” Chart. Data: FBI Crime Data Explorer, Uniform Crime Reporting Program, https://cde.ucr.cjis.gov/LATEST/webapp/#/pages/explorer/crime/crime-trend (data as of December 31, 2025). https://chart.ly/charts/murder-rate-by-city-over-100000 (accessed November 4, 2026).
Free for your article, blog or class page: paste this code where the chart should go. It shows the interactive chart with its source and a small “Chart by Chartly” credit, and stays up to date when the data changes. Need it without the credit? Join the Chartly Pro waitlist.
The data
Download data (CSV)The file has the numbers in this table, with the source, license and date. Please credit the source and Chartly. Developers can also get them as JSON (how).
Get new charts weekly
One email a week with the newest charts and their key numbers. No account needed.
More Crime charts
-
Which big U.S. cities' murder rates fell most since 2019?
From 2019, the year before murders jumped across the country, to 2025, the murder rate fell most in Baltimore, MD (-58.5%), Corpus Christi, TX (-56.4%) and T...
Source: FBI Crime Data Explorer, Uniform Crime Reporting Program · Data as of Dec 31, 2025
-
Which big U.S. cities' murder rates fell most in the last year?
Of the 79 big U.S. cities (250,000 people or more) whose police reported every month of 2025 and the year before to the FBI, the murder rate fell most in Irv...
Source: FBI Crime Data Explorer, Uniform Crime Reporting Program · Data as of Dec 31, 2025
-
Which big U.S. cities have the most robberies?
In 2025, Baltimore, MD had the highest robbery rate of the 89 biggest U.S. cities whose police reported a full year to the FBI, about 417 per 100,000 people,...
Source: FBI Crime Data Explorer, Uniform Crime Reporting Program · Data as of Dec 31, 2025
-
Which big U.S. cities have the most property crime?
In 2025, Oakland, CA had the highest property crime rate of the 89 biggest U.S. cities whose police reported a full year to the FBI, about 5,255 per 100,000 ...
Source: FBI Crime Data Explorer, Uniform Crime Reporting Program · Data as of Dec 31, 2025