Who owns the US national debt?
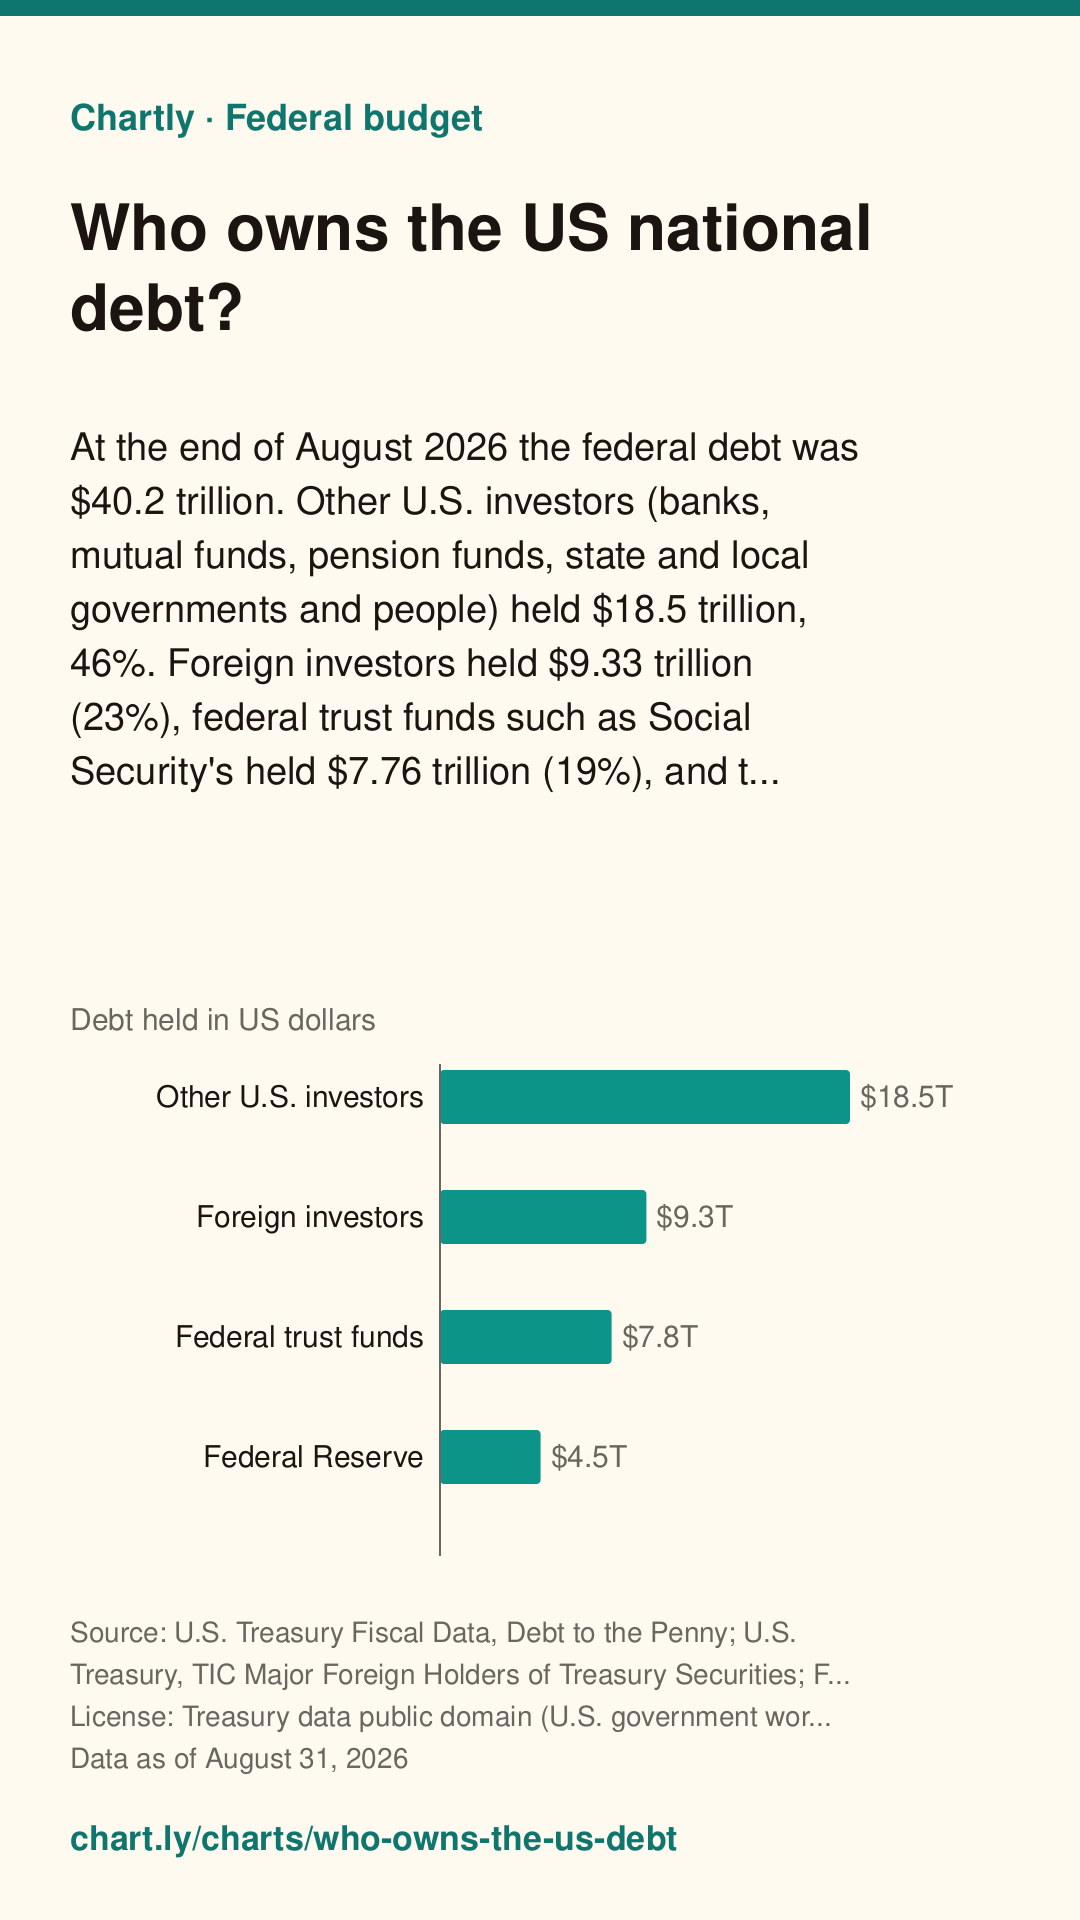
At the end of August 2026 the federal debt was $40.2 trillion. Other U.S. investors (banks, mutual funds, pension funds, state and local governments and people) held $18.5 trillion, 46%. Foreign investors held $9.33 trillion (23%), federal trust funds such as Social Security's held $7.76 trillion (19%), and the Federal Reserve $4.55 trillion (11%). Foreign holdings are Treasury's TIC estimate, partly at market value, and the U.S. share is what's left after the others, so the split is approximate.
The interactive chart needs JavaScript. The numbers are in the table below.
The value axis starts at zero. Hover, tap or use the arrow keys to read exact values.
Save a simple drawing of this chart for slides, essays or posts, with its question, source, date and a link back to this page. Please keep the credit.
Download image
A tall picture for Pinterest or an Instagram story, with the question, answer, source, date and this page's address.
Chartly Pro: downloads and embeds without the credit. Join the waitlist
It doesn't exist yet. Tell us what you'd use it for, and we'll email you once when it's ready. Downloads and embeds with the credit stay free.
Key facts
Measure: Debt held in US dollars. Written from the data below.
- Other U.S. investors has the highest figure, $18.5T.
- Federal Reserve has the lowest figure, $4.55T.
- The highest is 4.1 times the lowest.
The bigger picture, in plain words: Is the national debt growing faster than the economy?
Teachers: add this chart to a class assignment, one link to post in Google Classroom, Canvas or Moodle.
Source and date
- Data as of
- Published
Citation
Chartly. “Who owns the US national debt?” Chart. Data: U.S. Treasury Fiscal Data, Debt to the Penny; U.S. Treasury, TIC Major Foreign Holders of Treasury Securities; Federal Reserve Bank of New York, SOMA Holdings, https://fiscaldata.treasury.gov/datasets/debt-to-the-penny/ (data as of August 31, 2026). https://chart.ly/charts/who-owns-the-us-debt (accessed November 6, 2026).
Free for your article, blog or class page: paste this code where the chart should go. It shows the interactive chart with its source and a small “Chart by Chartly” credit, and stays up to date when the data changes. Need it without the credit? Join the Chartly Pro waitlist.
The data
Download data (CSV)The file has the numbers in this table, with the source, license and date. Please credit the source and Chartly. Developers can also get them as JSON (how).
| Owner | Debt held in US dollars |
|---|---|
| Other U.S. investors | 18,537,119,939,200 |
| Foreign investors | 9,331,700,000,000 |
| Federal trust funds | 7,760,652,224,459 |
| Federal Reserve | 4,546,168,907,975 |
Get new charts weekly
One email a week with the newest charts and their key numbers. No account needed.
More Federal budget charts
-
When will Social Security's trust funds run out?
The Trustees' latest projection has Social Security's combined trust funds down to $183 billion at the end of 2033 and running out the year after. Their rese...
Source: Social Security Administration, 2026 OASDI Trustees Report, Table VI.G2 (combined OASI and DI Trust Funds, intermediate assumptions) · Data as of Dec 31, 2025
-
How much US debt does the Federal Reserve own?
The Federal Reserve held $4.58 trillion of Treasury securities on October 28, 2026, compared with a peak of $5.77 trillion in May 2022. Its holdings jumped w...
Source: Federal Reserve Bank of New York, System Open Market Account (SOMA) Holdings · Data as of Oct 28, 2026
-
How much US debt does Japan own?
Japan held $1.07 trillion of U.S. Treasury securities in August 2026, up from $326 billion in March 2000. Its holdings peaked at $1.33 trillion in November 2...
Source: U.S. Treasury, Treasury International Capital (TIC) System, Major Foreign Holders of Treasury Securities · Data as of Aug 31, 2026
-
How much US debt does China own?
Mainland China held $591 billion of U.S. Treasury securities in August 2026, compared with its peak of $1.32 trillion in November 2013. In March 2000 it held...
Source: U.S. Treasury, Treasury International Capital (TIC) System, Major Foreign Holders of Treasury Securities · Data as of Aug 31, 2026