Which U.S.-listed companies make the most profit?
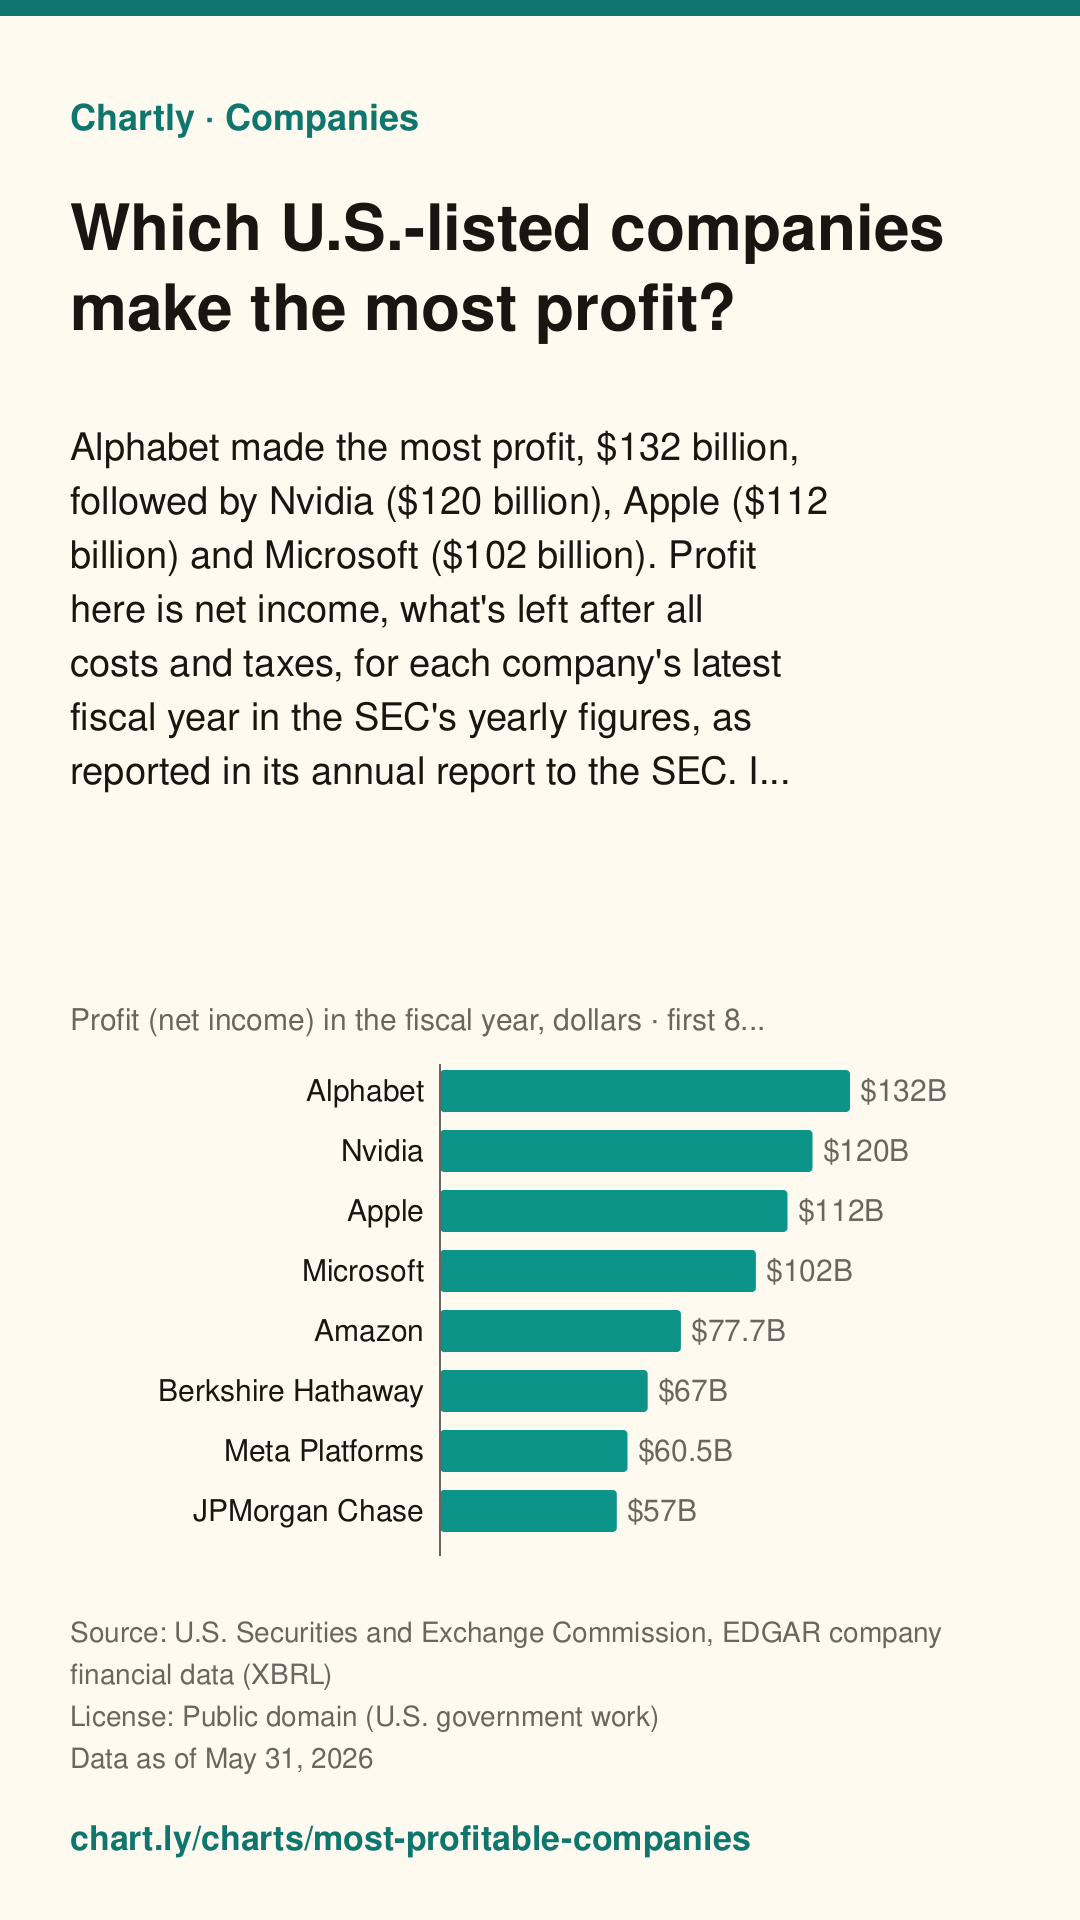
Alphabet made the most profit, $132 billion, followed by Nvidia ($120 billion), Apple ($112 billion) and Microsoft ($102 billion). Profit here is net income, what's left after all costs and taxes, for each company's latest fiscal year in the SEC's yearly figures, as reported in its annual report to the SEC. It covers U.S.-listed companies reporting under U.S. accounting rules; a profit bigger than the company's revenue is a tagging mistake and is left out.
The interactive chart needs JavaScript. The numbers are in the table below.
Bars are sorted from highest to lowest and start at zero; each one's value is at its end. On a phone it opens on the top and bottom 10; tap “Show all” for the rest.
Save a simple drawing of this chart for slides, essays or posts, with its question, source, date and a link back to this page. Please keep the credit.
Download image
A tall picture for Pinterest or an Instagram story, with the question, answer, source, date and this page's address.
Chartly Pro: downloads and embeds without the credit. Join the waitlist
It doesn't exist yet. Tell us what you'd use it for, and we'll email you once when it's ready. Downloads and embeds with the credit stay free.
Key facts
Measure: Profit (net income) in the fiscal year, dollars. Written from the data below.
- Alphabet has the highest figure, $132B, followed by Nvidia ($120B) and Apple ($112B).
- Amgen has the lowest figure, $7.71B, followed by Pfizer ($7.77B) and ConocoPhillips ($7.99B).
- The highest is 17 times the lowest.
Teachers: add this chart to a class assignment, one link to post in Google Classroom, Canvas or Moodle.
Source and date
- Data as of
- Published
Citation
Chartly. “Which U.S.-listed companies make the most profit?” Chart. Data: U.S. Securities and Exchange Commission, EDGAR company financial data (XBRL), https://www.sec.gov/search-filings/edgar-application-programming-interfaces (data as of May 31, 2026). https://chart.ly/charts/most-profitable-companies (accessed November 6, 2026).
Free for your article, blog or class page: paste this code where the chart should go. It shows the interactive chart with its source and a small “Chart by Chartly” credit, and stays up to date when the data changes. Need it without the credit? Join the Chartly Pro waitlist.
The data
Download data (CSV)The file has the numbers in this table, with the source, license and date. Please credit the source and Chartly. Developers can also get them as JSON (how).
| Company | Profit (net income) in the fiscal year, dollars | Reported in |
|---|---|---|
| Alphabet | 132,170,000,000 | Filing |
| Nvidia | 120,067,000,000 | Filing |
| Apple | 112,010,000,000 | Filing |
| Microsoft | 101,832,000,000 | Filing |
| Amazon | 77,670,000,000 | Filing |
| Berkshire Hathaway | 66,968,000,000 | Filing |
| Meta Platforms | 60,458,000,000 | Filing |
| JPMorgan Chase | 57,000,000,000 | Filing |
| Bank of America | 30,509,000,000 | Filing |
| Exxon Mobil | 28,844,000,000 | Filing |
| Johnson & Johnson | 26,804,000,000 | Filing |
| Broadcom | 23,126,000,000 | Filing |
| AT&T | 21,953,000,000 | Filing |
| Walmart | 21,893,000,000 | Filing |
| Eli Lilly | 20,640,000,000 | Filing |
| Visa | 20,058,000,000 | Filing |
| Comcast | 19,998,000,000 | Filing |
| Merck | 18,254,000,000 | Filing |
| Verizon Communications | 17,608,000,000 | Filing |
| Oracle | 16,984,000,000 | Filing |
| Procter & Gamble | 15,974,000,000 | Filing |
| Alibaba Group Holding | 15,018,000,000 | Filing |
| Mastercard | 14,968,000,000 | Filing |
| Citigroup | 14,306,000,000 | Filing |
| Home Depot | 14,160,000,000 | Filing |
| PDD Holdings | 13,991,297,000 | Filing |
| Coca Cola | 13,107,000,000 | Filing |
| Walt Disney | 12,404,000,000 | Filing |
| Chevron | 12,300,000,000 | Filing |
| UnitedHealth Group | 12,056,000,000 | Filing |
| Philip Morris International | 11,348,000,000 | Filing |
| Progressive | 11,308,000,000 | Filing |
| T-Mobile US | 10,992,000,000 | Filing |
| Netflix | 10,981,000,000 | Filing |
| American Express | 10,833,000,000 | Filing |
| IBM | 10,593,000,000 | Filing |
| Chubb | 10,310,000,000 | Filing |
| Cisco Systems | 10,180,000,000 | Filing |
| Allstate | 10,165,000,000 | Filing |
| Uber Technologies | 10,053,000,000 | Filing |
| Caterpillar | 8,884,000,000 | Filing |
| General Electric | 8,704,000,000 | Filing |
| McDonald’s | 8,563,000,000 | Filing |
| Micron Technology | 8,539,000,000 | Filing |
| Gilead Sciences | 8,510,000,000 | Filing |
| PepsiCo | 8,240,000,000 | Filing |
| Costco Wholesale | 8,099,000,000 | Filing |
| ConocoPhillips | 7,988,000,000 | Filing |
| Pfizer | 7,771,000,000 | Filing |
| Amgen | 7,711,000,000 | Filing |
Get new charts weekly
One email a week with the newest charts and their key numbers. No account needed.
More Companies charts
-
What does any public company report in revenue, profit, cash and buybacks?
Type any U.S.-listed company's name or ticker to see its revenue, profit, cash and stock buybacks each fiscal year, exactly as it reported them to the SEC, w...
Source: U.S. Securities and Exchange Commission, EDGAR company financial data (XBRL) · Data as of Sep 26, 2026
-
How much cash do the biggest U.S.-listed companies hold?
Of the 25 largest U.S.-listed companies by revenue, JPMorgan Chase held the most cash at the end of its latest fiscal year: $343 billion. Banks such as JPMor...
Source: U.S. Securities and Exchange Commission, EDGAR company financial data (XBRL) · Data as of Mar 31, 2026
-
Which companies spend the most buying back their own stock?
Apple spent $90.7 billion buying back its own shares in its latest fiscal year, about 2 times as much as Alphabet ($45.7 billion), with Nvidia next ($40.1 bi...
Source: U.S. Securities and Exchange Commission, EDGAR company financial data (XBRL) · Data as of Jun 28, 2026
-
Which U.S.-listed companies bring in the most revenue?
Amazon brought in $717 billion and Walmart $713 billion in their latest fiscal years, followed by UnitedHealth Group ($448 billion) in third. Each company's ...
Source: U.S. Securities and Exchange Commission, EDGAR company financial data (XBRL) · Data as of May 31, 2026