What is the median household net worth by age?
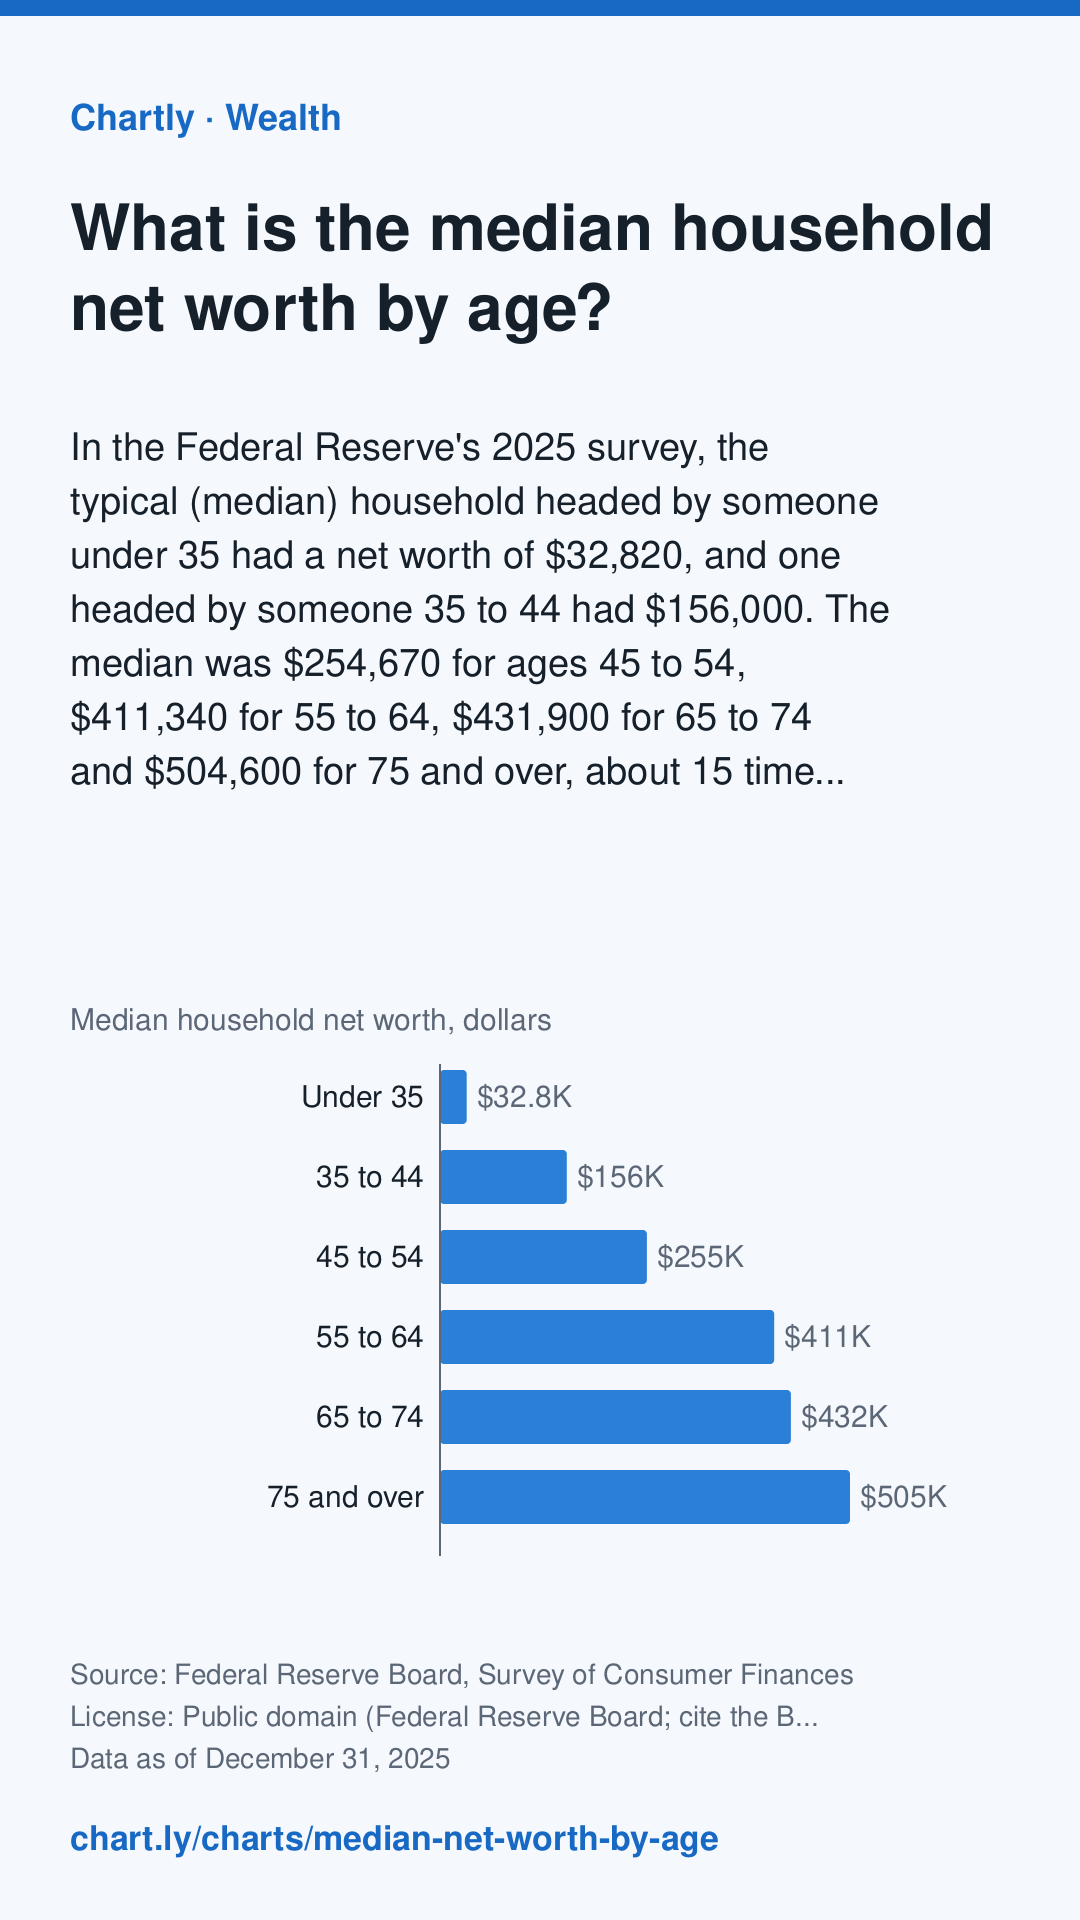
In the Federal Reserve's 2025 survey, the typical (median) household headed by someone under 35 had a net worth of $32,820, and one headed by someone 35 to 44 had $156,000. The median was $254,670 for ages 45 to 54, $411,340 for 55 to 64, $431,900 for 65 to 74 and $504,600 for 75 and over, about 15 times the under-35s'. The median is the household in the middle: half have more and half less. Averages are much higher, because a few households are very rich. Net worth is what a household owns (homes, retirement accounts, stocks, businesses, cars, bank accounts) minus what it owes (mortgages, student and car loans, credit cards). The survey is taken every three years, and figures are in dollars of the survey year. People of different ages also lived through different times, so this compares age groups, not one household's path through life.
The interactive chart needs JavaScript. The numbers are in the table below.
The value axis starts at zero. Hover, tap or use the arrow keys to read exact values.
Save a simple drawing of this chart for slides, essays or posts, with its question, source, date and a link back to this page. Please keep the credit.
Download image
A tall picture for Pinterest or an Instagram story, with the question, answer, source, date and this page's address.
Chartly Pro: downloads and embeds without the credit. Join the waitlist
It doesn't exist yet. Tell us what you'd use it for, and we'll email you once when it's ready. Downloads and embeds with the credit stay free.
Key facts
Measure: Median household net worth, dollars. Written from the data below.
- 75 and over has the highest figure, $504,600, followed by 65 to 74 ($431,900) and 55 to 64 ($411,340).
- Under 35 has the lowest figure, $32,820, followed by 35 to 44 ($156,000) and 45 to 54 ($254,670).
- The highest is 15 times the lowest.
The bigger picture, in plain words: How much wealth do Americans have at each age?
Writing about this? Key numbers with a citation for each: U.S. wealth statistics
This chart is one of the 50 in The U.S. in 50 charts, 2026, a yearly report of the key numbers on how the country is doing.
A related question: How much wealth does each age group hold?
Check your net worth
How does your net worth compare? Check your net worth against the typical household your age, with a page for each age group. Your number stays in your browser.
For class
Lesson page and class link · More chart lessonsHow to read this chart
Each bar is the median net worth of households, grouped by the age of the person who heads them. Net worth is what a household owns, such as a home, savings and retirement accounts, minus what it owes, such as a mortgage or student loans. The median is the household in the middle: half have more and half have less.
Questions to discuss
- Which age group has the highest median net worth, and about how many times the under-35 group's is it?
- Why might net worth keep rising through most of a working life, and why might it fall for the oldest group?
- A few very rich households pull the average far above the median. Why is the median a better picture of a typical household?
Teachers: add this chart to a class assignment, one link to post in Google Classroom, Canvas or Moodle.
Source and date
- Data as of
- Published
Cite this chart
For an essay or article: copy the style your class or editor uses.
-
MLA
“What Is the Median Household Net Worth by Age?” Chartly, 31 Dec. 2025, chart.ly/charts/median-net-worth-by-age. Accessed 12 Nov. 2026.
-
APA
Chartly. (2025, December 31). What is the median household net worth by age? [Chart]. Retrieved November 12, 2026, from https://chart.ly/charts/median-net-worth-by-age
-
Chicago
Chartly. “What Is the Median Household Net Worth by Age?” Chart. Data from Federal Reserve Board, Survey of Consumer Finances. Updated December 31, 2025. Accessed November 12, 2026. https://chart.ly/charts/median-net-worth-by-age.
Free for your article, blog or class page: paste this code where the chart should go. It shows the interactive chart with its source and a small “Chart by Chartly” credit, and stays up to date when the data changes. Need it without the credit? Join the Chartly Pro waitlist.
The data
Download data (CSV)The file has the numbers in this table, with the source, license and date. Please credit the source and Chartly. Developers can also get them as JSON (how). Every wealth chart's data is in one file too.
| Age of household head | Median household net worth, dollars |
|---|---|
| Under 35 | 32,820 |
| 35 to 44 | 156,000 |
| 45 to 54 | 254,670 |
| 55 to 64 | 411,340 |
| 65 to 74 | 431,900 |
| 75 and over | 504,600 |
Get new charts weekly
One email a week with the newest charts and their key numbers. No account needed.
More Wealth charts
-
Who owns U.S. stocks and mutual funds?
In the quarter ending June 2026, the wealthiest 1% of U.S. households held 50.9% of the stocks and mutual funds that households own directly, the next 9% hel...
Source: Federal Reserve Board, Distributional Financial Accounts · Data as of Jun 30, 2026
-
Who owns the value of U.S. homes?
In the quarter ending June 2026, the next 40% of U.S. households by wealth held 46.6% of the value of the homes households live in. The wealthiest 1% held 13...
Source: Federal Reserve Board, Distributional Financial Accounts · Data as of Jun 30, 2026
-
Who owns America's private businesses?
In the quarter ending June 2026, the wealthiest 1% of U.S. households held 53.0% of the value of private businesses, the next 9% held 31.8%, the next 40% hel...
Source: Federal Reserve Board, Distributional Financial Accounts · Data as of Jun 30, 2026
-
How much wealth does each generation hold?
In the quarter ending June 2026, households headed by baby boomers (born 1946 to 1964) held $97.4 trillion, 52.5% of all U.S. household wealth. Gen X (born 1...
Source: Federal Reserve Board, Distributional Financial Accounts · Data as of Jun 30, 2026