How many food recalls are for salmonella each year?
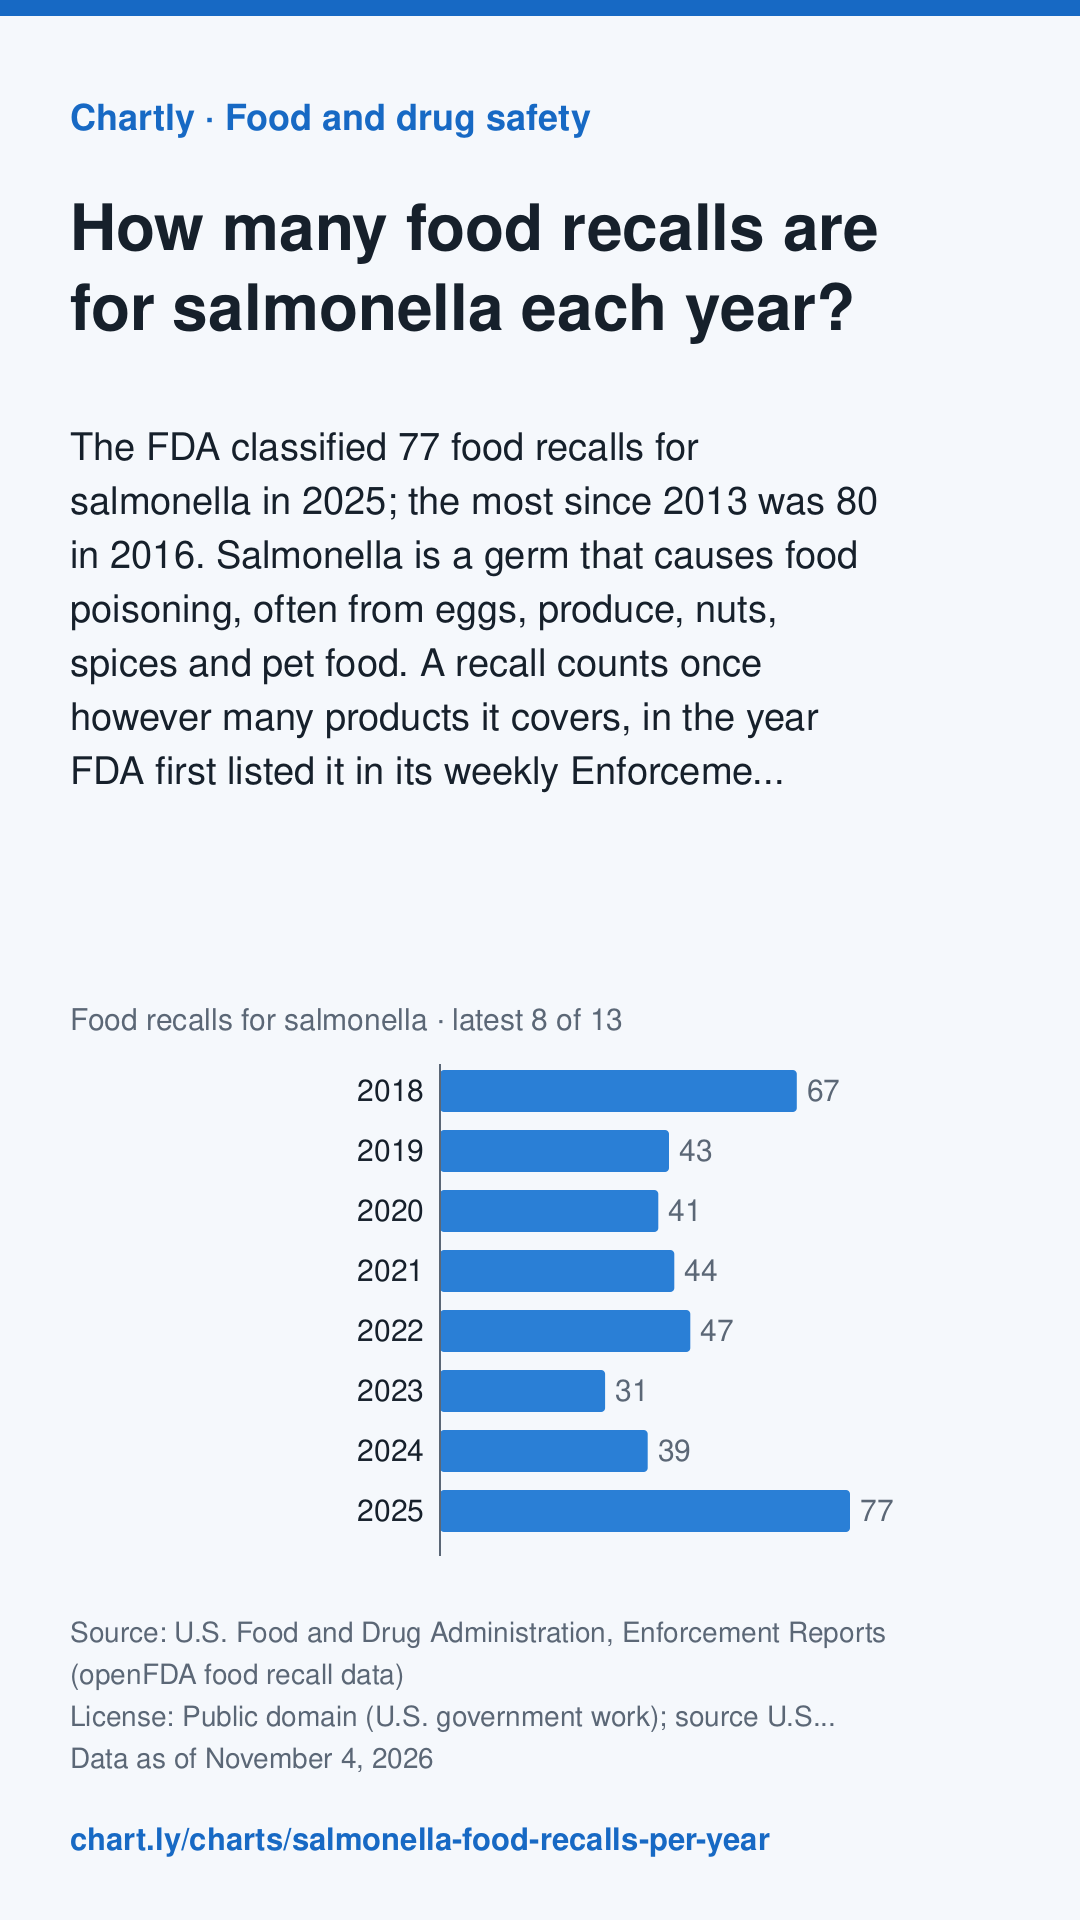
The FDA classified 77 food recalls for salmonella in 2025; the most since 2013 was 80 in 2016. Salmonella is a germ that causes food poisoning, often from eggs, produce, nuts, spices and pet food. A recall counts once however many products it covers, in the year FDA first listed it in its weekly Enforcement Report. Chartly sorted FDA's written reasons by their key words; a recall that names listeria too is counted on the listeria chart instead. Meat, poultry and most egg products are USDA's to recall and aren't included. The newest salmonella recalls, this year's included, are listed below.
The interactive chart needs JavaScript. The numbers are in the table below.
The value axis starts at zero. Hover, tap or use the arrow keys to read exact values.
Save a simple drawing of this chart for slides, essays or posts, with its question, source, date and a link back to this page. Please keep the credit.
Download image
A tall picture for Pinterest or an Instagram story, with the question, answer, source, date and this page's address.
Chartly Pro: downloads and embeds without the credit. Join the waitlist
It doesn't exist yet. Tell us what you'd use it for, and we'll email you once when it's ready. Downloads and embeds with the credit stay free.
Key facts
Measure: Food recalls for salmonella. Written from the data below.
- The latest figure, for 2025, is 77.
- That is up 24% from 62 in 2013.
- The highest was 80 in 2016.
- The lowest was 31 in 2023.
The newest salmonella recalls
Newest first, as of November 4, 2026. The source's own words are in quotes.
-
Class I (most serious)
EDEN BROTHERS (Arden, NC): EDEN BROTHERS Broccoli Seeds - Calabrese
“Salmonella”
-
Class I (most serious)
FORTUNA MARKETING, INC (Poway, CA): ZestiGreens Broccoli Seeds for Sprouting & Microgreens
“Broccoli seeds potentially contaminated with Salmonella”
-
Class I (most serious)
“Salmonella.”
-
Class I (most serious)
“Salmonella”
-
Class I (most serious)
Wild West Seed Inc (Albany, OR): Wild West Seeds Broccoli Seeds Green Sprouting Calabrese lot #4105
“Salmonella”
-
Class I (most serious)
Berlin Seeds (Millersburg, OH): Berlin Seeds Alfalfa Sprouting Seeds
“Product contains alfalfa seed recalled by the supplier due to potential E. coli and/or Salmonella contamination.”
-
Class I (most serious)
“Potential Salmonella contamination.”
-
Class I (most serious)
Salata Dressings, LLC (Houston, TX): Salata Salad Kitchen Jalapeno Avocado Dressing
“This recall was initiated due to potential Salmonella contamination in diced jalapeno received from the supplier”
-
Class I (most serious)
“Products contain alfalfa seed recalled by the supplier and may be contaminated with E. coli and/or Salmonella (downstream recall)”
-
Class I (most serious)
Evergreen Fresh Sprouts LLC (Moyie Springs, ID): Evergreen Fresh Sprouts LLC, Broccoli Sprouts
“Salmonella”
-
Class I (most serious)
“Sprouts may be contaminated with STEC E. coli and/or Salmonella.”
-
Class I (most serious)
FOODS ALIVE INC. (Angola, IN): Foods Alive organic moringa leaf powder
“Potential Salmonella contamination”
-
Class I (most serious)
“Jalapenos have the potential to be contaminated with Salmonella”
-
Class I (most serious)
Taylor Fresh Foods Inc (Salinas, CA): Pineapple Mango Salsa Mild (25 products)
“Potential contamination with Salmonella.”
-
Class II
Panorama Produce Sales Inc. (Mamaroneck, NY): Martina brand Fresh Whole Mangoes
“Product may be contaminated with Salmonella”
-
Class I (most serious)
International Sprout Holdings, Inc (Cookeville, TN): Alfalfa
“Potential E. coli and Salmonella contamination”
-
Class I (most serious)
“Products were manufactured with jalapenos that have the potential to be contaminated with Salmonella”
-
Class I (most serious)
THE HAMPTON GROCER (Montauk, NY): THE HAMPTON GROCER brand
“Product may be contaminated with Salmonella.”
-
Class I (most serious)
Botticelli Foods, LLC (Hauppauge, NY): bettergoods brand Pistachio Nut Butter
“Product may be contaminated with Salmonella.”
-
Class I (most serious)
“Potential Salmonella Javiana contamination”
The bigger picture, in plain words: Are food recalls going up?
What was recalled lately? See every food recall in November 2026, or any month since 2020, in plain words.
Teachers: add this chart to a class assignment, one link to post in Google Classroom, Canvas or Moodle.
Source and date
- Data as of
- Published
Cite this chart
For an essay or article: copy the style your class or editor uses.
-
MLA
“How Many Food Recalls Are for Salmonella Each Year?” Chartly, 4 Nov. 2026, chart.ly/charts/salmonella-food-recalls-per-year. Accessed 13 Nov. 2026.
-
APA
Chartly. (2026, November 4). How many food recalls are for salmonella each year? [Chart]. Retrieved November 13, 2026, from https://chart.ly/charts/salmonella-food-recalls-per-year
-
Chicago
Chartly. “How Many Food Recalls Are for Salmonella Each Year?” Chart. Data from U.S. Food and Drug Administration, Enforcement Reports (openFDA food recall data). Updated November 4, 2026. Accessed November 13, 2026. https://chart.ly/charts/salmonella-food-recalls-per-year.
Free for your article, blog or class page: paste this code where the chart should go. It shows the interactive chart with its source and a small “Chart by Chartly” credit, and stays up to date when the data changes. Need it without the credit? Join the Chartly Pro waitlist.
The data
Download data (CSV)The file has the numbers in this table, with the source, license and date. Please credit the source and Chartly. Developers can also get them as JSON (how). Every food and drug safety chart's data is in one file too.
| Year FDA classified the recall | Food recalls for salmonella |
|---|---|
| 2013 | 62 |
| 2014 | 75 |
| 2015 | 72 |
| 2016 | 80 |
| 2017 | 79 |
| 2018 | 67 |
| 2019 | 43 |
| 2020 | 41 |
| 2021 | 44 |
| 2022 | 47 |
| 2023 | 31 |
| 2024 | 39 |
| 2025 | 77 |
Get new charts weekly
One email a week with the newest charts and their key numbers. No account needed.
More Food and drug safety charts
-
How many food recalls are for listeria each year?
The FDA classified 63 food recalls for listeria in 2025; the most since 2013 was 139 in 2016. Listeria is a germ that can grow in the refrigerator and is mos...
Source: U.S. Food and Drug Administration, Enforcement Reports (openFDA food recall data) · Data as of Oct 21, 2026
-
How many food recalls are for undeclared allergens each year?
The FDA classified 190 food recalls in 2025 for an allergen left off the label, such as milk, peanuts, tree nuts, wheat, soy, eggs, fish, shellfish or sesame...
Source: U.S. Food and Drug Administration, Enforcement Reports (openFDA food recall data) · Data as of Nov 4, 2026
-
How many drug recalls are there each month?
The FDA classified 30 drug recalls in October 2026. Since January 2025, the monthly count has ranged from 17 in February 2026 to 44 in July 2026. Each recall...
Source: U.S. Food and Drug Administration, Enforcement Reports (openFDA drug recall data) · Data as of Nov 4, 2026
-
How many food recalls are there each month?
The FDA classified 43 food recalls in October 2026. Since January 2025, the monthly count has ranged from 30 in May 2025 to 69 in October 2025. Each recall c...
Source: U.S. Food and Drug Administration, Enforcement Reports (openFDA food recall data) · Data as of Nov 4, 2026