How many points does an NFL team score per game?
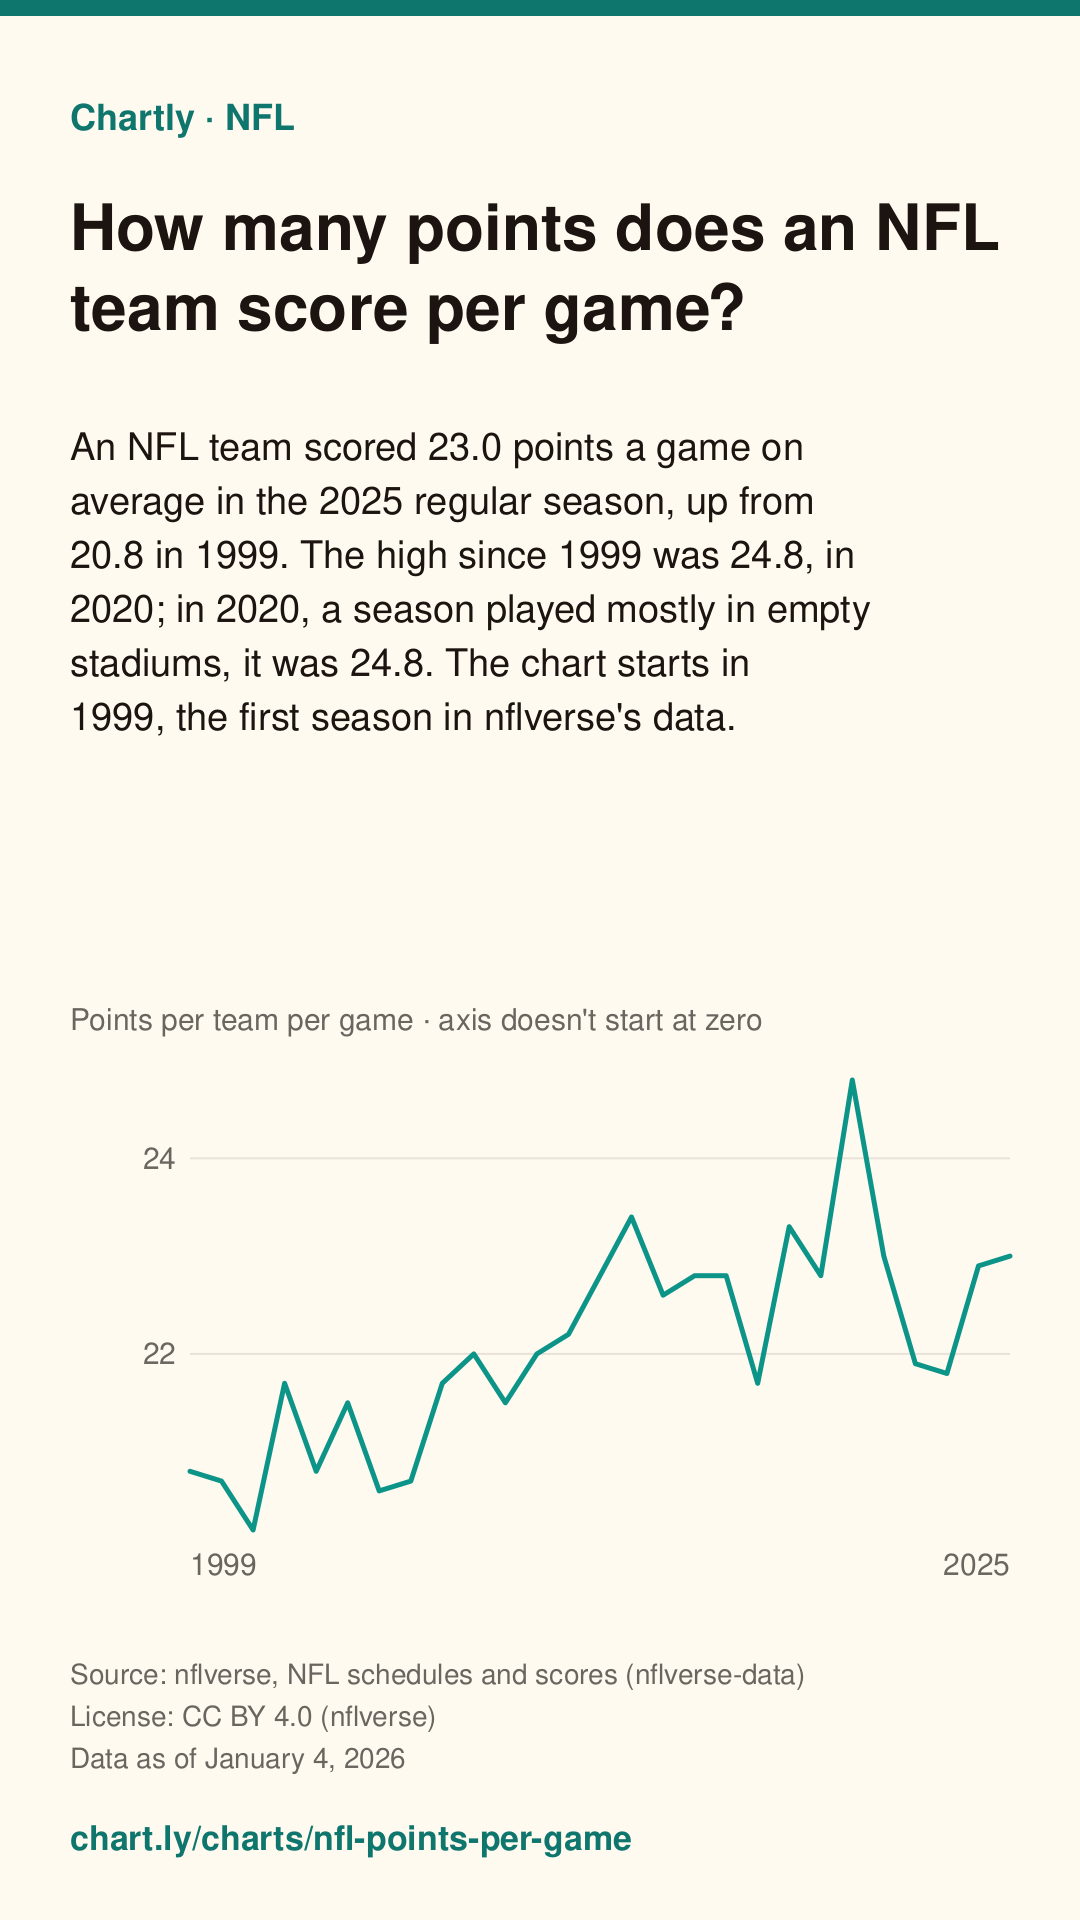
An NFL team scored 23.0 points a game on average in the 2025 regular season, up from 20.8 in 1999. The high since 1999 was 24.8, in 2020; in 2020, a season played mostly in empty stadiums, it was 24.8. The chart starts in 1999, the first season in nflverse's data.
The interactive chart needs JavaScript. The numbers are in the table below.
The value axis doesn't start at zero, because the change is what matters here and a line drawn from zero would flatten it. Hover, tap or use the arrow keys to read exact values.
Save a simple drawing of this chart for slides, essays or posts, with its question, source, date and a link back to this page. Please keep the credit.
Download image
A tall picture for Pinterest or an Instagram story, with the question, answer, source, date and this page's address.
Chartly Pro: downloads and embeds without the credit. Join the waitlist
It doesn't exist yet. Tell us what you'd use it for, and we'll email you once when it's ready. Downloads and embeds with the credit stay free.
Key facts
Measure: Points per team per game. Written from the data below.
- The latest figure, for 2025, is 23.
- That is up 2.2 from 20.8 in 1999.
- The highest was 24.8 in 2020.
- The lowest was 20.2 in 2001.
Teachers: add this chart to a class assignment, one link to post in Google Classroom, Canvas or Moodle.
Source and date
- License
- CC BY 4.0 (nflverse)
- Data as of
- Published
Citation
Chartly. “How many points does an NFL team score per game?” Chart. Data: nflverse, NFL schedules and scores (nflverse-data), https://github.com/nflverse/nflverse-data/releases/tag/schedules (data as of January 4, 2026). https://chart.ly/charts/nfl-points-per-game (accessed November 4, 2026).
Free for your article, blog or class page: paste this code where the chart should go. It shows the interactive chart with its source and a small “Chart by Chartly” credit, and stays up to date when the data changes. Need it without the credit? Join the Chartly Pro waitlist.
The data
Download data (CSV)The file has the numbers in this table, with the source, license and date. Please credit the source and Chartly.
| Season | Points per team per game |
|---|---|
| 1999 | 20.8 |
| 2000 | 20.7 |
| 2001 | 20.2 |
| 2002 | 21.7 |
| 2003 | 20.8 |
| 2004 | 21.5 |
| 2005 | 20.6 |
| 2006 | 20.7 |
| 2007 | 21.7 |
| 2008 | 22 |
| 2009 | 21.5 |
| 2010 | 22 |
| 2011 | 22.2 |
| 2012 | 22.8 |
| 2013 | 23.4 |
| 2014 | 22.6 |
| 2015 | 22.8 |
| 2016 | 22.8 |
| 2017 | 21.7 |
| 2018 | 23.3 |
| 2019 | 22.8 |
| 2020 | 24.8 |
| 2021 | 23 |
| 2022 | 21.9 |
| 2023 | 21.8 |
| 2024 | 22.9 |
| 2025 | 23 |
Get new charts weekly
One email a week with the newest charts and their key numbers. No account needed.
More NFL charts
-
How often do NFL teams pass instead of run?
Passes were 56.2% of NFL passing and running plays in the 2025 regular season, against a high of 59.3% in 2016 and 1999's 57.0%. Sacks count as passes and qu...
Source: nflverse, NFL team season stats (nflverse-data) · Data as of Jan 4, 2026
-
How often do NFL teams try 50-yard field goals?
NFL games had 0.98 field goal tries of 50 yards or longer each in the 2025 regular season, both teams together, against 1999's 0.34. Counting per game means ...
Source: nflverse, NFL team season stats (nflverse-data) · Data as of Jan 4, 2026
-
How often are 50-yard NFL field goals good?
NFL kickers made 68.8% of field goal tries of 50 yards or longer in the 2025 regular season, up from 48.8% in 1999; the best season since 1999 was 2024, at 6...
Source: nflverse, NFL team season stats (nflverse-data) · Data as of Jan 4, 2026
-
How often do NFL home teams win?
Home teams won 53.8% of NFL regular-season games in 2025; from 1999 to 2018 they usually won 55% to 60%. In 2020, played mostly without fans, it fell to 50.4...
Source: nflverse, NFL schedules and scores (nflverse-data) · Data as of Jan 4, 2026