What does a year at a private college cost after grants?
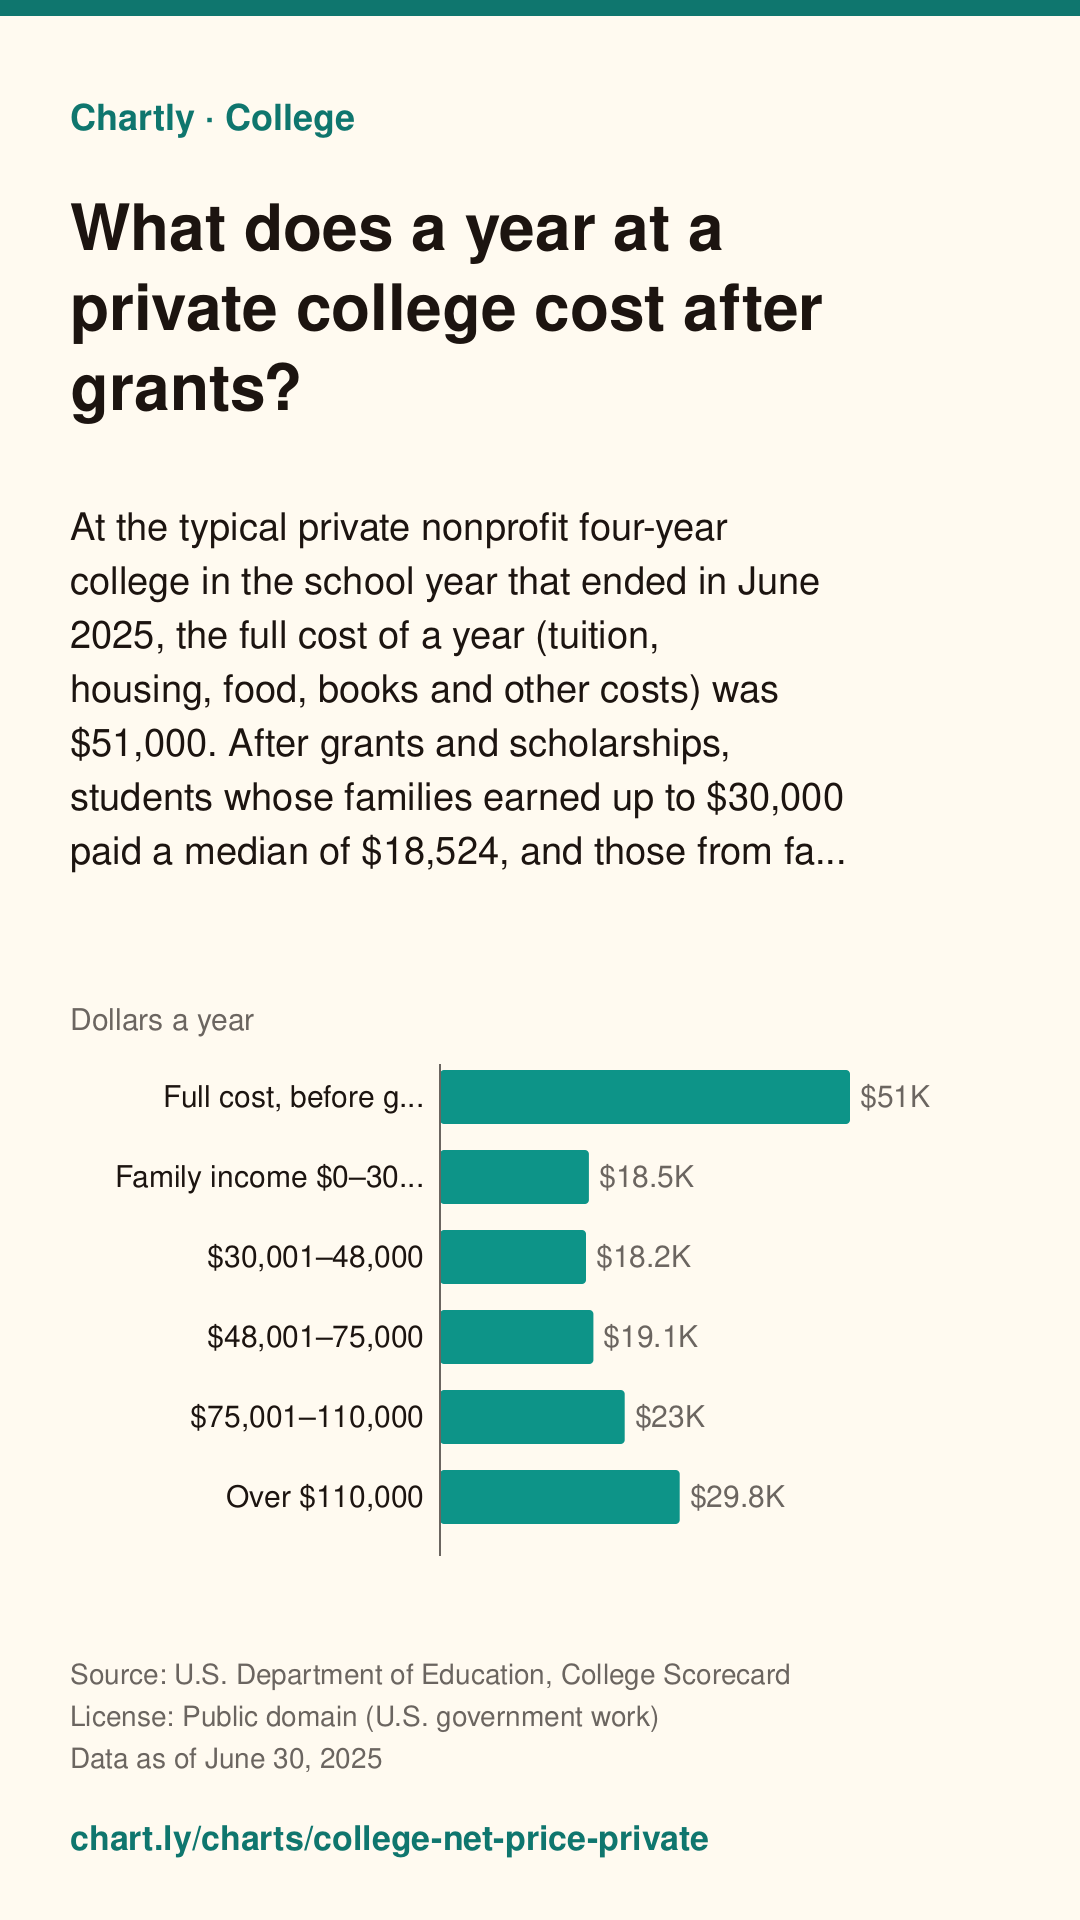
At the typical private nonprofit four-year college in the school year that ended in June 2025, the full cost of a year (tuition, housing, food, books and other costs) was $51,000. After grants and scholarships, students whose families earned up to $30,000 paid a median of $18,524, and those from families earning over $110,000 paid $29,820, still below the full cost. Net prices count first-time, full-time undergraduates who received federal aid; each bar is the median of colleges' averages. Loans are not subtracted, because they have to be repaid.
The interactive chart needs JavaScript. The numbers are in the table below.
The value axis starts at zero. Hover, tap or use the arrow keys to read exact values.
Save a simple drawing of this chart for slides, essays or posts, with its question, source, date and a link back to this page. Please keep the credit.
Download image
A tall picture for Pinterest or an Instagram story, with the question, answer, source, date and this page's address.
Chartly Pro: downloads and embeds without the credit. Join the waitlist
It doesn't exist yet. Tell us what you'd use it for, and we'll email you once when it's ready. Downloads and embeds with the credit stay free.
Key facts
Measure: Dollars a year. Written from the data below.
- Full cost, before grants has the highest figure, $51,000, followed by Over $110,000 ($29,820) and $75,001–110,000 ($22,978).
- $30,001–48,000 has the lowest figure, $18,158, followed by Family income $0–30,000 ($18,524) and $48,001–75,000 ($19,087).
- The highest is 2.8 times the lowest.
Teachers: add this chart to a class assignment, one link to post in Google Classroom, Canvas or Moodle.
Source and date
- Data as of
- Published
Citation
Chartly. “What does a year at a private college cost after grants?” Chart. Data: U.S. Department of Education, College Scorecard, https://collegescorecard.ed.gov/data/ (data as of June 30, 2025). https://chart.ly/charts/college-net-price-private (accessed November 4, 2026).
Free for your article, blog or class page: paste this code where the chart should go. It shows the interactive chart with its source and a small “Chart by Chartly” credit, and stays up to date when the data changes. Need it without the credit? Join the Chartly Pro waitlist.
The data
Download data (CSV)The file has the numbers in this table, with the source, license and date. Please credit the source and Chartly. Developers can also get them as JSON (how).
| Full cost, then net price by family income | Dollars a year |
|---|---|
| Full cost, before grants | 51,000 |
| Family income $0–30,000 | 18,524 |
| $30,001–48,000 | 18,158 |
| $48,001–75,000 | 19,087 |
| $75,001–110,000 | 22,978 |
| Over $110,000 | 29,820 |
Get new charts weekly
One email a week with the newest charts and their key numbers. No account needed.
More College charts
-
What does your college cost a family earning under $30,000?
Search 1,713 colleges that mainly award bachelor's degrees. In the school year that ended in June 2025, students from families earning $30,000 or less paid a...
Source: U.S. Department of Education, College Scorecard · Data as of Jun 30, 2025
-
What does your college cost after grants?
Search 1,769 colleges that mainly award bachelor's degrees. In the school year that ended in June 2025, the average net price, what a year cost after grants ...
Source: U.S. Department of Education, College Scorecard · Data as of Jun 30, 2025
-
How much do students from your college earn 10 years later?
Search 1,782 colleges that mainly award bachelor's degrees. Ten years after starting, former students of Ohio State earned a median of $67,080 a year, and th...
Source: U.S. Department of Education, College Scorecard · Data as of Dec 31, 2023
-
How big is student debt compared with pay, by major?
Graduates in the 20 most common bachelor's majors borrow similar amounts in federal student loans at the typical college, but their pay differs widely. For t...
Source: U.S. Department of Education, College Scorecard · Data as of Dec 31, 2023