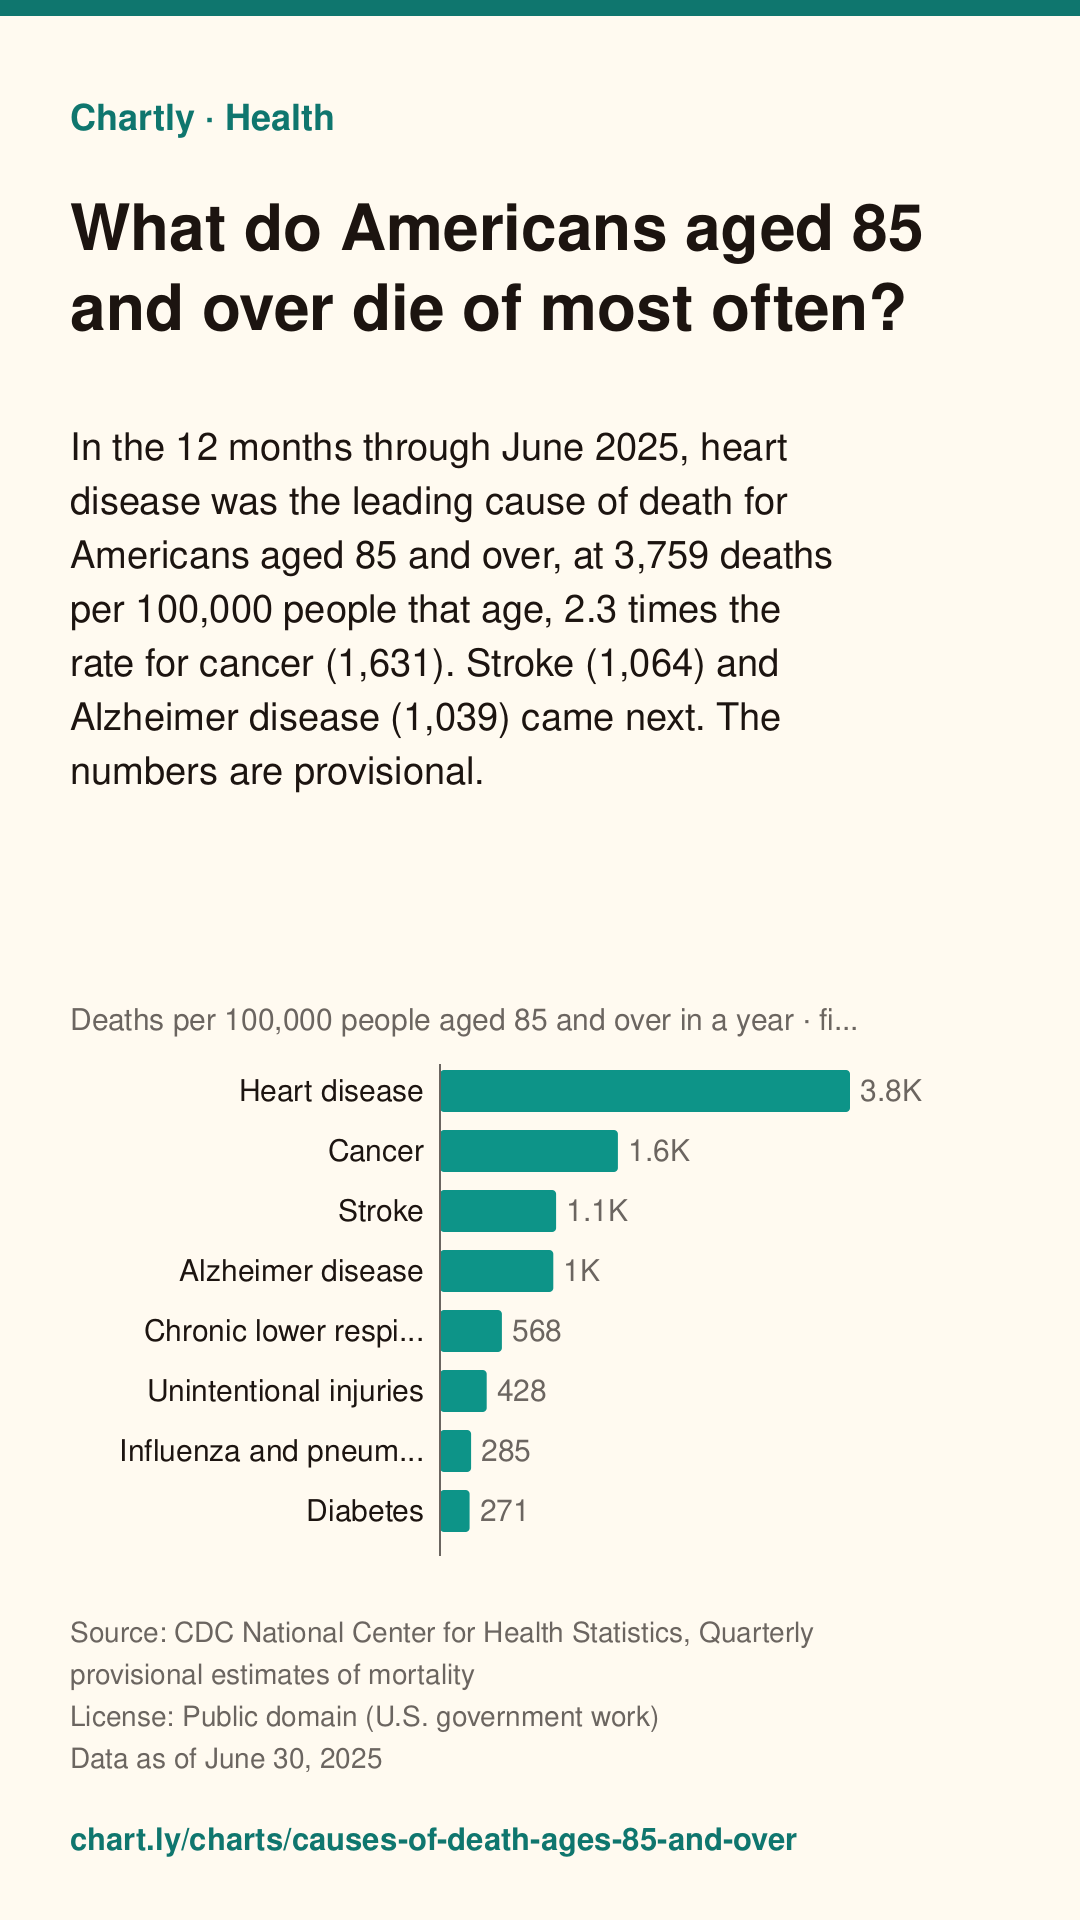
What do Americans aged 85 and over die of most often?
In the 12 months through June 2025, heart disease was the leading cause of death for Americans aged 85 and over, at 3,759 deaths per 100,000 people that age, 2.3 times the rate for cancer (1,631). Stroke (1,064) and Alzheimer disease (1,039) came next. The numbers are provisional.
The interactive chart needs JavaScript. The numbers are in the table below.
The value axis starts at zero. Hover, tap or use the arrow keys to read exact values.
Save a simple drawing of this chart for slides, essays or posts, with its question, source, date and a link back to this page. Please keep the credit.
Download image
A tall picture for Pinterest or an Instagram story, with the question, answer, source, date and this page's address.
Chartly Pro: downloads and embeds without the credit. Join the waitlist
It doesn't exist yet. Tell us what you'd use it for, and we'll email you once when it's ready. Downloads and embeds with the credit stay free.
Key facts
Measure: Deaths per 100,000 people aged 85 and over in a year. Written from the data below.
- Heart disease has the highest figure, 3,759.1, followed by Cancer (1,630.7) and Stroke (1,064.4).
- Hypertension has the lowest figure, 247.9, followed by Kidney disease (257.2) and Diabetes (271.4).
- The highest is 15 times the lowest.
Teachers: add this chart to a class assignment, one link to post in Google Classroom, Canvas or Moodle.
Source and date
- Data as of
- Published
Citation
Chartly. “What do Americans aged 85 and over die of most often?” Chart. Data: CDC National Center for Health Statistics, Quarterly provisional estimates of mortality, https://www.cdc.gov/nchs/nvss/vsrr/mortality-dashboard.htm (data as of June 30, 2025). https://chart.ly/charts/causes-of-death-ages-85-and-over (accessed November 4, 2026).
Free for your article, blog or class page: paste this code where the chart should go. It shows the interactive chart with its source and a small “Chart by Chartly” credit, and stays up to date when the data changes. Need it without the credit? Join the Chartly Pro waitlist.
The data
Download data (CSV)The file has the numbers in this table, with the source, license and date. Please credit the source and Chartly. Developers can also get them as JSON (how).
| Cause of death | Deaths per 100,000 people aged 85 and over in a year |
|---|---|
| Heart disease | 3,759.1 |
| Cancer | 1,630.7 |
| Stroke | 1,064.4 |
| Alzheimer disease | 1,039.2 |
| Chronic lower respiratory diseases | 567.8 |
| Unintentional injuries | 428.1 |
| Influenza and pneumonia | 285.1 |
| Diabetes | 271.4 |
| Kidney disease | 257.2 |
| Hypertension | 247.9 |
Get new charts weekly
One email a week with the newest charts and their key numbers. No account needed.
More Health charts
-
What do Americans aged 45 to 54 die of most often?
In the 12 months through June 2025, cancer (79.6 deaths per 100,000 people aged 45 to 54) and heart disease (72.0) were the leading causes of death in this a...
Source: CDC National Center for Health Statistics, Quarterly provisional estimates of mortality · Data as of Jun 30, 2025
-
What do young Americans aged 15 to 24 die of most often?
In the 12 months through June 2025, the leading cause of death for Americans aged 15 to 24 was unintentional injuries, at 24.0 deaths per 100,000 people that...
Source: CDC National Center for Health Statistics, Quarterly provisional estimates of mortality · Data as of Jun 30, 2025
-
How has the US cancer death rate changed since 1900?
The US cancer death rate rose from 114.8 deaths per 100,000 people in 1900 to a peak of 216.0 in 1990, then fell 31% to 149.1 by 2018. Rates are age-adjusted...
Source: CDC National Center for Health Statistics, Age-adjusted death rates for selected major causes of death · Data as of Dec 31, 2018
-
How long do Americans live, and how has that changed since 1900?
A baby born in the US in 2018 could expect to live 78.7 years, up from 47.3 in 1900. The sharpest drop was in 1918, to 39.1 years, during the influenza pande...
Source: CDC National Center for Health Statistics, Death rates and life expectancy at birth · Data as of Dec 31, 2018