How much does each state spend per public school student?
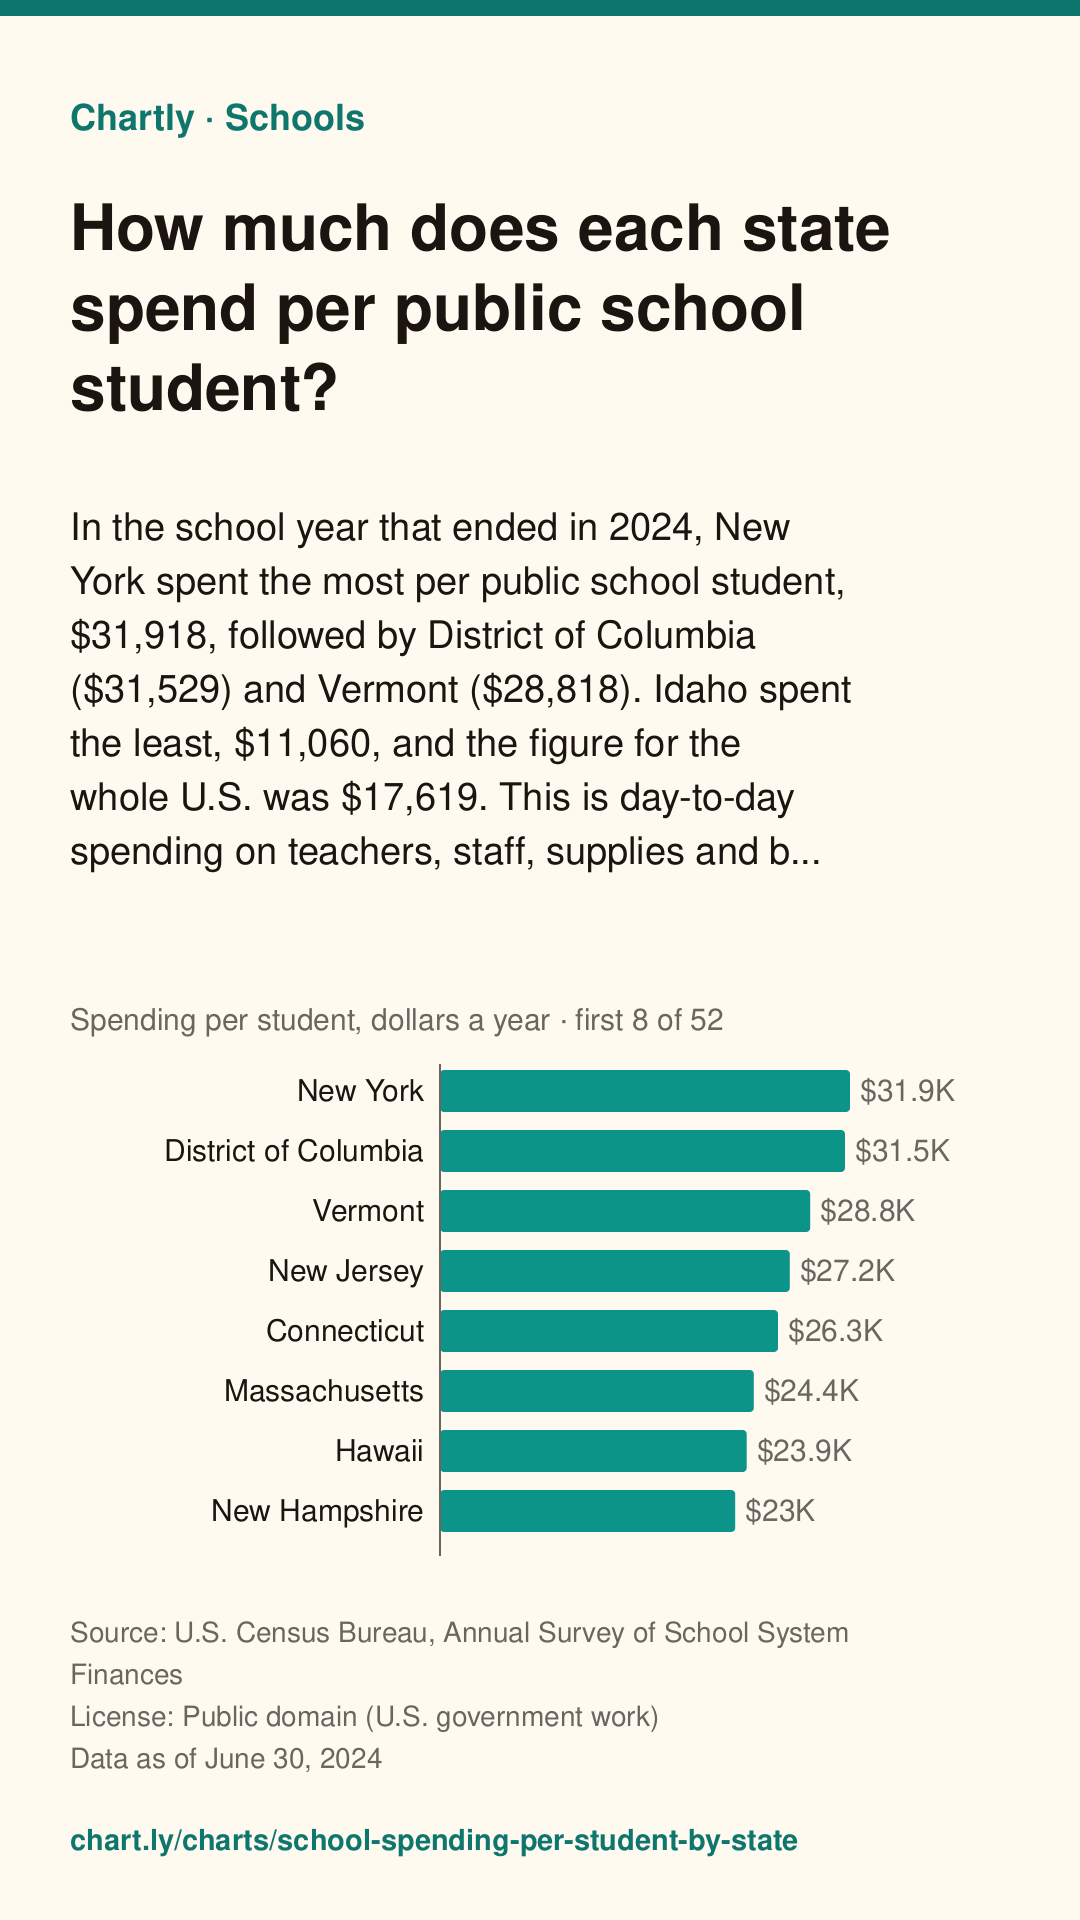
In the school year that ended in 2024, New York spent the most per public school student, $31,918, followed by District of Columbia ($31,529) and Vermont ($28,818). Idaho spent the least, $11,060, and the figure for the whole U.S. was $17,619. This is day-to-day spending on teachers, staff, supplies and buses, not on buildings or debt, and it isn't adjusted for each state's prices.
The interactive chart needs JavaScript. The numbers are in the table below.
Bars are sorted from highest to lowest and start at zero; each one's value is at its end. The dashed line is “United States”, for comparison. On a phone it opens on the top and bottom 10; tap “Show all” for the rest.
Save a simple drawing of this chart for slides, essays or posts, with its question, source, date and a link back to this page. Please keep the credit.
Download image
A tall picture for Pinterest or an Instagram story, with the question, answer, source, date and this page's address.
Chartly Pro: downloads and embeds without the credit. Join the waitlist
It doesn't exist yet. Tell us what you'd use it for, and we'll email you once when it's ready. Downloads and embeds with the credit stay free.
Key facts
Measure: Spending per student, dollars a year. Written from the data below.
- New York has the highest figure, $31,918, followed by District of Columbia ($31,529) and Vermont ($28,818).
- Idaho has the lowest figure, $11,060, followed by Utah ($11,347) and Arizona ($12,003).
- The highest is 2.9 times the lowest.
- United States: $17,619. Of the 51 compared, 21 are above it and 30 below.
Each of the 100 largest school districts has its own page: find your school district to see its spending per student and students next to its state's and the U.S. figures.
Teachers: add this chart to a class assignment, one link to post in Google Classroom, Canvas or Moodle.
Source and date
- Data as of
- Published
Citation
Chartly. “How much does each state spend per public school student?” Chart. Data: U.S. Census Bureau, Annual Survey of School System Finances, https://www.census.gov/programs-surveys/school-finances/data/tables.html (data as of June 30, 2024). https://chart.ly/charts/school-spending-per-student-by-state (accessed November 4, 2026).
Free for your article, blog or class page: paste this code where the chart should go. It shows the interactive chart with its source and a small “Chart by Chartly” credit, and stays up to date when the data changes. Need it without the credit? Join the Chartly Pro waitlist.
The data
Download data (CSV)The file has the numbers in this table, with the source, license and date. Please credit the source and Chartly. Developers can also get them as JSON (how).
| State | Spending per student, dollars a year |
|---|---|
| New York | 31,918 |
| District of Columbia | 31,529 |
| Vermont | 28,818 |
| New Jersey | 27,234 |
| Connecticut | 26,316 |
| Massachusetts | 24,429 |
| Hawaii | 23,878 |
| New Hampshire | 22,978 |
| Delaware | 22,201 |
| Rhode Island | 22,110 |
| Illinois | 21,776 |
| Pennsylvania | 21,091 |
| Alaska | 21,004 |
| California | 20,791 |
| Wyoming | 20,521 |
| Maryland | 20,208 |
| Maine | 19,962 |
| Washington | 18,564 |
| Michigan | 18,314 |
| Oregon | 18,083 |
| New Mexico | 17,664 |
| United States | 17,619 |
| Ohio | 17,257 |
| Virginia | 17,104 |
| North Dakota | 17,102 |
| Minnesota | 17,098 |
| Nebraska | 16,147 |
| Wisconsin | 15,952 |
| Colorado | 15,908 |
| Georgia | 15,833 |
| West Virginia | 15,640 |
| Louisiana | 15,581 |
| Kansas | 15,558 |
| South Carolina | 15,060 |
| Nevada | 14,812 |
| Kentucky | 14,596 |
| Iowa | 14,369 |
| Missouri | 14,241 |
| Arkansas | 13,873 |
| Montana | 13,656 |
| Alabama | 13,627 |
| Indiana | 13,622 |
| North Carolina | 12,995 |
| Texas | 12,895 |
| Tennessee | 12,882 |
| South Dakota | 12,828 |
| Florida | 12,693 |
| Mississippi | 12,324 |
| Oklahoma | 12,162 |
| Arizona | 12,003 |
| Utah | 11,347 |
| Idaho | 11,060 |
Get new charts weekly
One email a week with the newest charts and their key numbers. No account needed.
More Schools charts
-
What are the largest school districts in the U.S.?
New York City, New York is the largest public school district, with 845,509 students, 2 times as many as Los Angeles Unified, California (419,929). Miami-Dad...
Source: U.S. Census Bureau, Annual Survey of School System Finances · Data as of Jun 30, 2024
-
Which big school districts spend the most per student?
In the school year that ended in 2024, New York City, New York spent $35,796 per student, the most of the nation's 100 largest public school districts, follo...
Source: U.S. Census Bureau, Annual Survey of School System Finances · Data as of Jun 30, 2024