Which national parks get the most visitors?
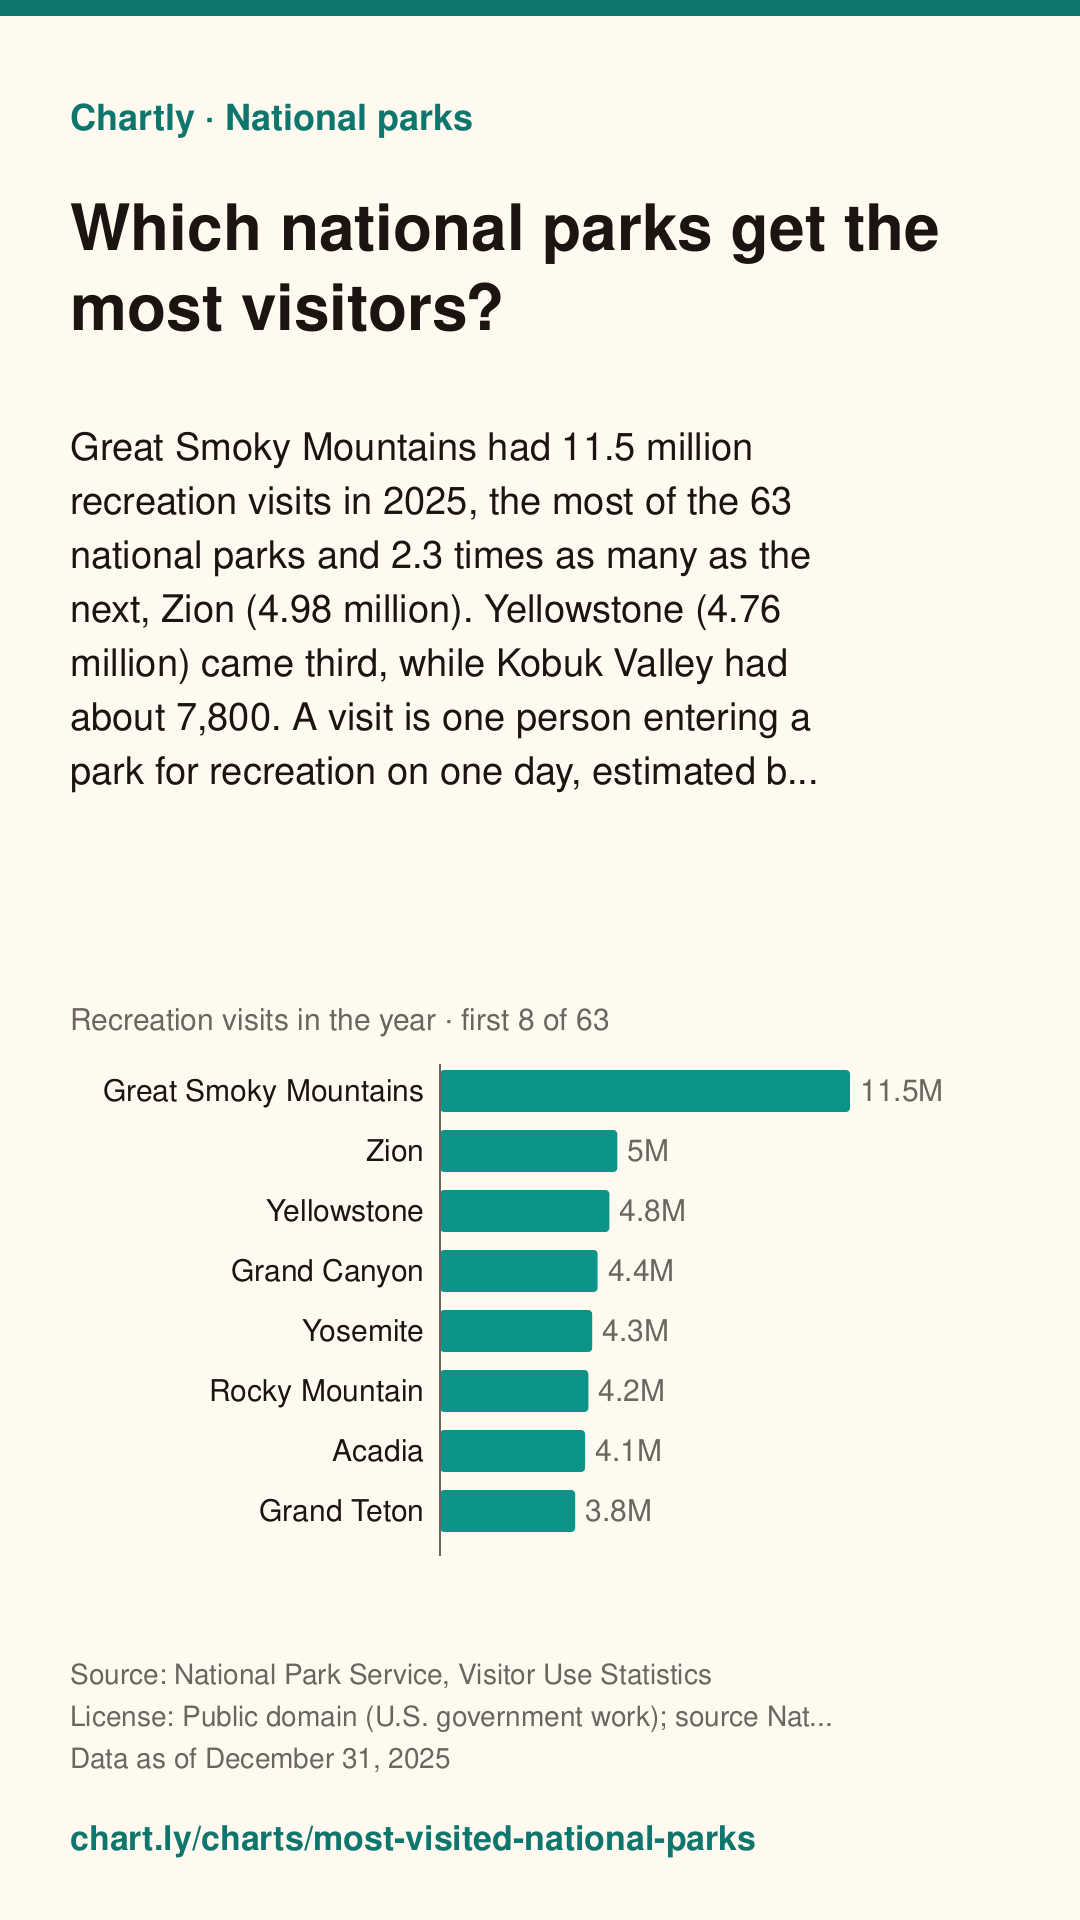
Great Smoky Mountains had 11.5 million recreation visits in 2025, the most of the 63 national parks and 2.3 times as many as the next, Zion (4.98 million). Yellowstone (4.76 million) came third, while Kobuk Valley had about 7,800. A visit is one person entering a park for recreation on one day, estimated by each park from traffic counters and sampling.
The interactive chart needs JavaScript. The numbers are in the table below.
Bars are sorted from highest to lowest and start at zero; each one's value is at its end. It opens on the top and bottom 10; use “Show all” or the search box for the rest.
Save a simple drawing of this chart for slides, essays or posts, with its question, source, date and a link back to this page. Please keep the credit.
Download image
A tall picture for Pinterest or an Instagram story, with the question, answer, source, date and this page's address.
Chartly Pro: downloads and embeds without the credit. Join the waitlist
It doesn't exist yet. Tell us what you'd use it for, and we'll email you once when it's ready. Downloads and embeds with the credit stay free.
Key facts
Measure: Recreation visits in the year. Written from the data below.
- Great Smoky Mountains has the highest figure, 11.5M, followed by Zion (4.98M) and Yellowstone (4.76M).
- Kobuk Valley has the lowest figure, 7,786, followed by Gates of the Arctic (14,923) and Lake Clark (19,778).
- The highest is 1,481 times the lowest.
Teachers: add this chart to a class assignment, one link to post in Google Classroom, Canvas or Moodle.
Source and date
- Data as of
- Published
Citation
Chartly. “Which national parks get the most visitors?” Chart. Data: National Park Service, Visitor Use Statistics, https://irma.nps.gov/Stats/ (data as of December 31, 2025). https://chart.ly/charts/most-visited-national-parks (accessed November 5, 2026).
Free for your article, blog or class page: paste this code where the chart should go. It shows the interactive chart with its source and a small “Chart by Chartly” credit, and stays up to date when the data changes. Need it without the credit? Join the Chartly Pro waitlist.
The data
Download data (CSV)The file has the numbers in this table, with the source, license and date. Please credit the source and Chartly. Developers can also get them as JSON (how).
| National park | Recreation visits in the year |
|---|---|
| Great Smoky Mountains | 11,527,939 |
| Zion | 4,984,525 |
| Yellowstone | 4,762,988 |
| Grand Canyon | 4,430,653 |
| Yosemite | 4,278,413 |
| Rocky Mountain | 4,171,431 |
| Acadia | 4,079,318 |
| Grand Teton | 3,800,648 |
| Olympic | 3,584,187 |
| Glacier | 3,136,557 |
| Cuyahoga Valley | 3,025,325 |
| Joshua Tree | 2,932,644 |
| Indiana Dunes | 2,629,497 |
| Hot Springs | 2,494,611 |
| Gateway Arch | 2,209,028 |
| Bryce Canyon | 1,967,367 |
| New River Gorge | 1,958,440 |
| Hawaii Volcanoes | 1,877,854 |
| Shenandoah | 1,682,152 |
| Mount Rainier | 1,635,342 |
| Arches | 1,511,740 |
| Capitol Reef | 1,388,476 |
| Sequoia | 1,378,337 |
| Death Valley | 1,320,134 |
| Redwood | 1,202,480 |
| Badlands | 1,139,361 |
| Haleakala | 853,711 |
| Saguaro | 847,749 |
| Canyonlands | 796,057 |
| Kings Canyon | 779,791 |
| Everglades | 778,198 |
| Glacier Bay | 740,044 |
| Theodore Roosevelt | 729,893 |
| Mammoth Cave | 660,734 |
| White Sands | 659,742 |
| Crater Lake | 632,242 |
| Wind Cave | 606,258 |
| Big Bend | 568,104 |
| Denali | 543,300 |
| Lassen Volcanic | 504,777 |
| Biscayne | 486,567 |
| Virgin Islands | 471,074 |
| Mesa Verde | 463,130 |
| Great Sand Dunes | 432,498 |
| Kenai Fjords | 425,369 |
| Carlsbad Caverns | 410,778 |
| Pinnacles | 343,208 |
| Petrified Forest | 315,951 |
| Congaree | 287,833 |
| Black Canyon of the Gunnison | 250,086 |
| Channel Islands | 227,186 |
| Guadalupe Mountains | 206,423 |
| Voyageurs | 206,326 |
| Great Basin | 161,210 |
| Wrangell-St. Elias | 108,840 |
| Dry Tortugas | 89,355 |
| North Cascades | 46,925 |
| American Samoa | 43,258 |
| Katmai | 34,479 |
| Isle Royale | 29,091 |
| Lake Clark | 19,778 |
| Gates of the Arctic | 14,923 |
| Kobuk Valley | 7,786 |
Get new charts weekly
One email a week with the newest charts and their key numbers. No account needed.
More National parks charts
-
Which National Park Service sites get the most visitors?
Blue Ridge Parkway had 16.5 million recreation visits in 2025, the most of any site the National Park Service runs, ahead of Golden Gate National Recreation ...
Source: National Park Service, Visitor Use Statistics · Data as of Dec 31, 2025
-
Which national parks grew fastest over 10 years?
Over the 10 years to 2025, Redwood's recreation visits grew 128%, the most of the parks compared. Hot Springs (76%), Kings Canyon (67%), Pinnacles (66%) and ...
Source: National Park Service, Visitor Use Statistics · Data as of Dec 31, 2025
-
How many people visit America's national parks each year?
Today's 63 national parks had 93.9 million recreation visits in 2025, against the record 94.3 million of 2024 and 52.6 million in 1979, when monthly counts b...
Source: National Park Service, Visitor Use Statistics · Data as of Dec 31, 2025
-
Which months are busiest in the national parks?
July was the busiest month of 2025 at the 63 national parks, with 13.9 million recreation visits, about 15% of the year's total and 4.7 times the 2.98 millio...
Source: National Park Service, Visitor Use Statistics · Data as of Dec 31, 2025