Which big U.S. cities have the highest household income?
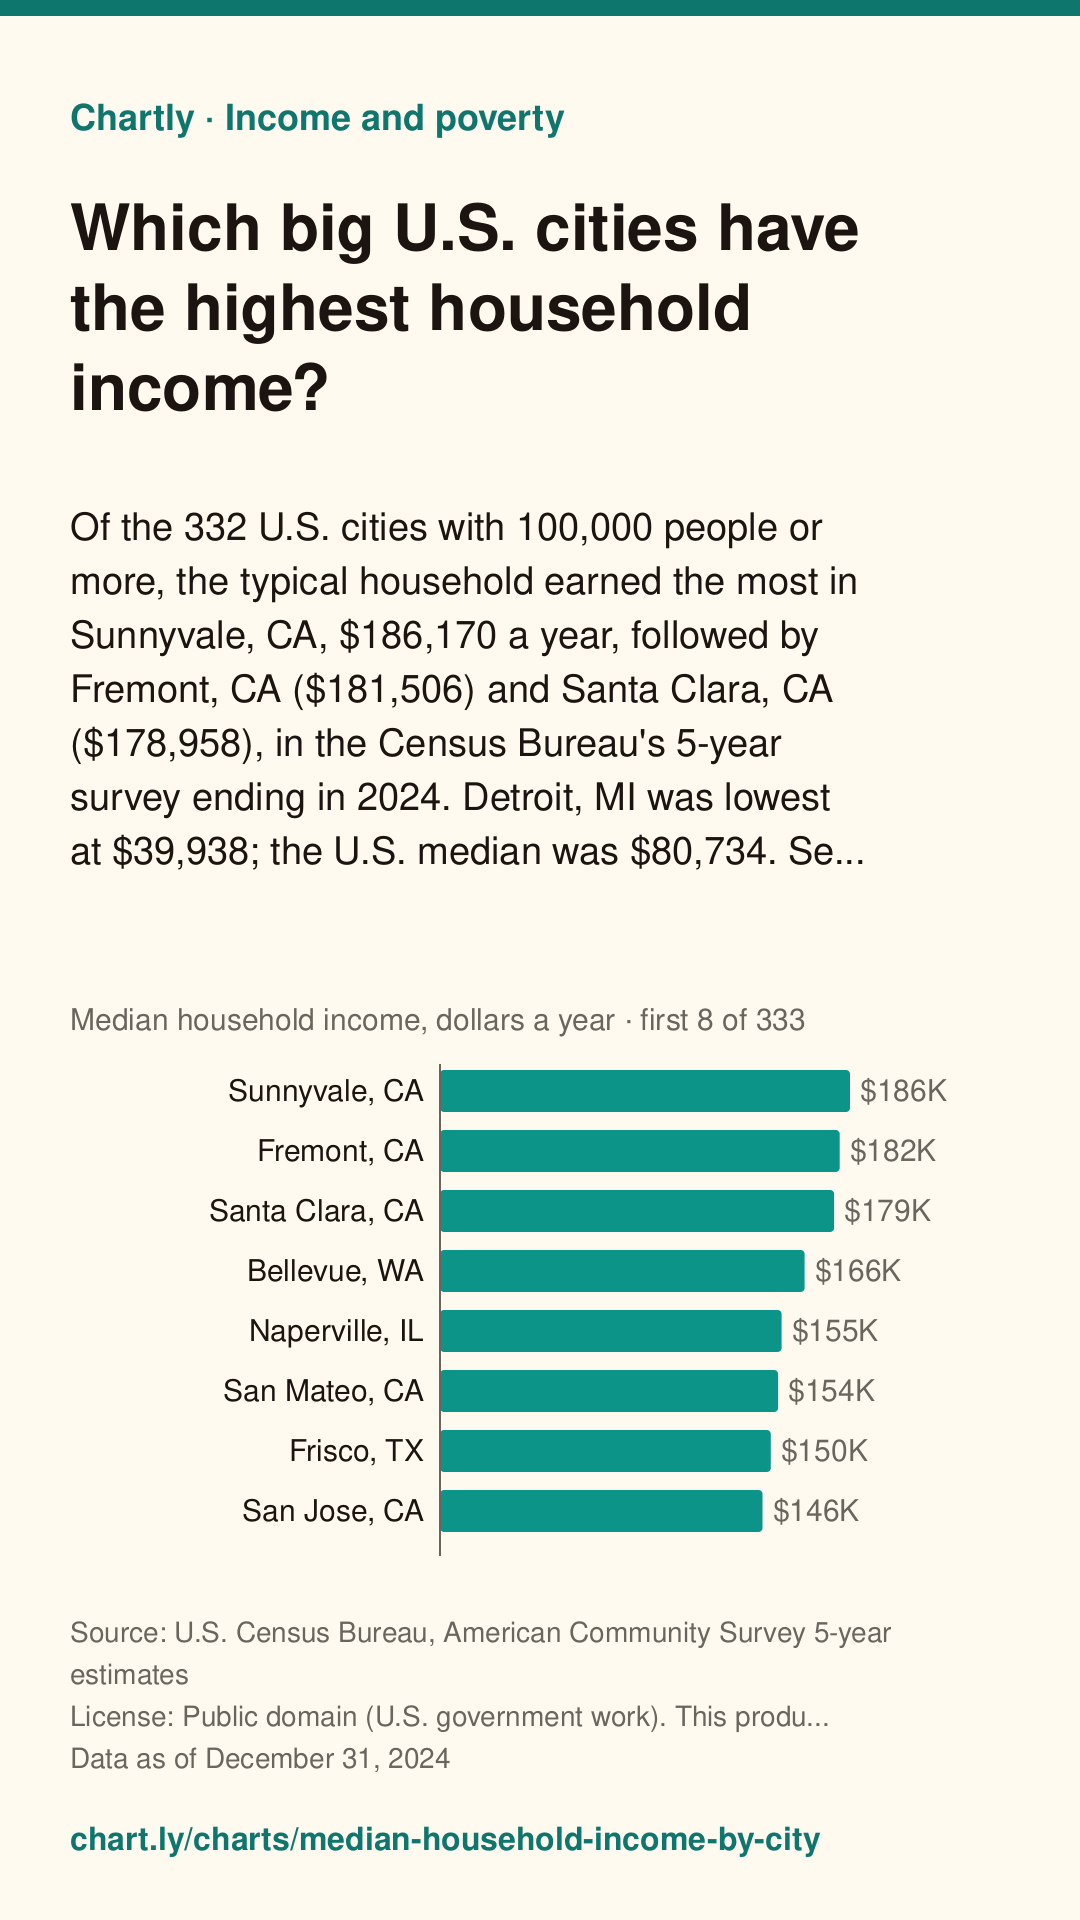
Of the 332 U.S. cities with 100,000 people or more, the typical household earned the most in Sunnyvale, CA, $186,170 a year, followed by Fremont, CA ($181,506) and Santa Clara, CA ($178,958), in the Census Bureau's 5-year survey ending in 2024. Detroit, MI was lowest at $39,938; the U.S. median was $80,734. Search any city. These are 5-year estimates in 2024 dollars, each with a margin of error.
The interactive chart needs JavaScript. The numbers are in the table below.
Bars are sorted from highest to lowest and start at zero; each one's value is at its end. The dashed line is “United States”, for comparison. It opens on the top and bottom 10; use “Show all” or the search box for the rest. These are survey estimates: the thin lines and the ± figures show each one's margin of error, and the true value is likely (90% confidence) within that range. Where ranges overlap, the difference may not be real.
Save a simple drawing of this chart for slides, essays or posts, with its question, source, date and a link back to this page. Please keep the credit.
Download image
A tall picture for Pinterest or an Instagram story, with the question, answer, source, date and this page's address.
Chartly Pro: downloads and embeds without the credit. Join the waitlist
It doesn't exist yet. Tell us what you'd use it for, and we'll email you once when it's ready. Downloads and embeds with the credit stay free.
Key facts
Measure: Median household income, dollars a year. Written from the data below.
- Sunnyvale, CA has the highest figure, $186,170, followed by Fremont, CA ($181,506) and Santa Clara, CA ($178,958).
- Detroit, MI has the lowest figure, $39,938, followed by Cleveland, OH ($40,801) and Jackson, MS ($42,071).
- The highest is 4.7 times the lowest.
- United States: $80,734. Of the 332 compared, 157 are above it and 175 below.
Teachers: add this chart to a class assignment, one link to post in Google Classroom, Canvas or Moodle.
Source and date
- Data as of
- Published
Citation
Chartly. “Which big U.S. cities have the highest household income?” Chart. Data: U.S. Census Bureau, American Community Survey 5-year estimates, https://www.census.gov/data/developers/data-sets/acs-5year.html (data as of December 31, 2024). https://chart.ly/charts/median-household-income-by-city (accessed November 4, 2026).
Free for your article, blog or class page: paste this code where the chart should go. It shows the interactive chart with its source and a small “Chart by Chartly” credit, and stays up to date when the data changes. Need it without the credit? Join the Chartly Pro waitlist.
The data
Download data (CSV)The file has the numbers in this table, with the source, license and date. Please credit the source and Chartly. Developers can also get them as JSON (how).
| City | Median household income, dollars a year | Margin of error (±) |
|---|---|---|
| Sunnyvale, CA | 186,170 | ±5,402 |
| Fremont, CA | 181,506 | ±3,676 |
| Santa Clara, CA | 178,958 | ±8,034 |
| Bellevue, WA | 165,576 | ±7,893 |
| Naperville, IL | 155,105 | ±4,387 |
| San Mateo, CA | 153,504 | ±7,504 |
| Frisco, TX | 150,212 | ±6,821 |
| San Jose, CA | 146,427 | ±2,140 |
| Carlsbad, CA | 142,748 | ±7,547 |
| Carmel, IN | 141,505 | ±6,599 |
| San Francisco, CA | 140,970 | ±2,593 |
| Irvine, CA | 136,719 | ±5,709 |
| Sugar Land, TX | 136,217 | ±5,041 |
| Thousand Oaks, CA | 135,603 | ±4,488 |
| Cary, NC | 134,905 | ±3,712 |
| Centennial, CO | 131,928 | ±5,953 |
| Allen, TX | 130,901 | ±8,183 |
| Cambridge, MA | 130,748 | ±3,564 |
| Fishers, IN | 130,203 | ±7,609 |
| Elk Grove, CA | 125,924 | ±3,447 |
| McKinney, TX | 124,215 | ±4,744 |
| Seattle, WA | 123,860 | ±2,244 |
| Daly City, CA | 123,547 | ±5,280 |
| Santa Clarita, CA | 123,062 | ±3,271 |
| Gilbert, AZ | 122,551 | ±3,414 |
| Simi Valley, CA | 122,081 | ±4,649 |
| League City, TX | 121,099 | ±6,514 |
| Temecula, CA | 121,063 | ±4,177 |
| Huntington Beach, CA | 120,919 | ±2,965 |
| Alexandria, VA | 119,681 | ±2,819 |
| Roseville, CA | 119,288 | ±3,284 |
| Pearland, TX | 118,842 | ±4,906 |
| Arvada, CO | 117,348 | ±3,724 |
| Orange, CA | 117,113 | ±4,442 |
| Torrance, CA | 116,217 | ±5,160 |
| Murrieta, CA | 114,081 | ±5,408 |
| Olathe, KS | 114,009 | ±2,589 |
| Hayward, CA | 113,318 | ±5,850 |
| Plano, TX | 112,253 | ±3,281 |
| Rancho Cucamonga, CA | 111,895 | ±3,824 |
| Stamford, CT | 111,586 | ±4,563 |
| Costa Mesa, CA | 111,505 | ±4,151 |
| Vacaville, CA | 111,126 | ±3,405 |
| Scottsdale, AZ | 110,886 | ±3,835 |
| Washington, DC | 109,870 | ±1,937 |
| Corona, CA | 109,242 | ±3,495 |
| Concord, CA | 108,709 | ±5,322 |
| West Jordan, UT | 108,153 | ±3,084 |
| Chandler, AZ | 108,095 | ±2,852 |
| Berkeley, CA | 108,092 | ±5,765 |
| San Diego, CA | 108,077 | ±1,463 |
| Chula Vista, CA | 108,032 | ±2,863 |
| Hillsboro, OR | 106,409 | ±2,499 |
| Boca Raton, FL | 106,273 | ±6,300 |
| Pasadena, CA | 105,192 | ±3,444 |
| Overland Park, KS | 104,834 | ±2,135 |
| Sandy Springs, GA | 104,340 | ±4,421 |
| Fullerton, CA | 104,286 | ±3,310 |
| Goodyear, AZ | 103,319 | ±4,008 |
| Anchorage, AK | 103,284 | ±2,702 |
| Thornton, CO | 103,088 | ±2,467 |
| Ventura, CA | 103,069 | ±2,883 |
| Fontana, CA | 102,821 | ±3,349 |
| Lee's Summit, MO | 102,531 | ±3,833 |
| Fairfield, CA | 101,895 | ±3,112 |
| Oakland, CA | 101,600 | ±2,146 |
| Carrollton, TX | 101,396 | ±2,668 |
| West Covina, CA | 101,065 | ±2,793 |
| Meridian, ID | 100,795 | ±2,565 |
| Renton, WA | 100,432 | ±3,956 |
| Westminster, CO | 100,272 | ±3,946 |
| Buckeye, AZ | 99,486 | ±3,832 |
| Round Rock, TX | 99,287 | ±4,128 |
| Clovis, CA | 99,241 | ±3,165 |
| Santa Rosa, CA | 99,060 | ±3,788 |
| Quincy, MA | 98,882 | ±4,519 |
| Richardson, TX | 98,111 | ±4,485 |
| Oceanside, CA | 97,737 | ±4,411 |
| Jersey City, NJ | 97,710 | ±3,907 |
| Jurupa Valley, CA | 97,550 | ±4,978 |
| Antioch, CA | 97,465 | ±5,717 |
| Boston, MA | 97,344 | ±1,837 |
| Burbank, CA | 97,082 | ±4,808 |
| Surprise, AZ | 96,711 | ±3,521 |
| Bend, OR | 96,394 | ±4,795 |
| Oxnard, CA | 96,212 | ±3,050 |
| Peoria, AZ | 95,815 | ±2,987 |
| Richmond, CA | 95,391 | ±4,367 |
| Chesapeake, VA | 95,373 | ±2,728 |
| Anaheim, CA | 95,227 | ±2,995 |
| Denver, CO | 94,718 | ±1,644 |
| Santa Ana, CA | 93,999 | ±2,896 |
| Austin, TX | 93,658 | ±1,670 |
| Aurora, IL | 93,633 | ±4,235 |
| Coral Springs, FL | 93,602 | ±3,323 |
| Menifee, CA | 93,454 | ±4,473 |
| Moreno Valley, CA | 93,222 | ±2,557 |
| Virginia Beach, VA | 92,968 | ±1,774 |
| Charleston, SC | 92,414 | ±3,404 |
| Kent, WA | 92,302 | ±3,984 |
| West Valley City, UT | 92,209 | ±3,041 |
| Joliet, IL | 92,201 | ±3,443 |
| Garden Grove, CA | 92,174 | ±2,652 |
| Escondido, CA | 91,967 | ±3,679 |
| Salinas, CA | 91,908 | ±2,961 |
| Riverside, CA | 91,045 | ±1,764 |
| Portland, OR | 90,919 | ±1,681 |
| Downey, CA | 90,699 | ±3,748 |
| Elgin, IL | 90,282 | ±3,200 |
| Vallejo, CA | 90,171 | ±3,810 |
| Henderson, NV | 90,138 | ±2,009 |
| Lakewood, CO | 89,792 | ±3,394 |
| Rio Rancho, NM | 89,596 | ±3,533 |
| Midland, TX | 89,585 | ±6,078 |
| Rochester, MN | 89,389 | ±2,992 |
| Lewisville, TX | 89,233 | ±3,214 |
| Miramar, FL | 89,125 | ±5,376 |
| Sparks, NV | 89,056 | ±2,599 |
| Ontario, CA | 88,941 | ±4,081 |
| Rialto, CA | 88,857 | ±4,120 |
| Glendale, CA | 88,393 | ±2,568 |
| Aurora, CO | 88,368 | ±2,017 |
| Boulder, CO | 87,493 | ±6,221 |
| Long Beach, CA | 87,430 | ±2,036 |
| Sacramento, CA | 87,321 | ±1,746 |
| Davie, FL | 87,250 | ±5,114 |
| Concord, NC | 86,921 | ±4,284 |
| Broken Arrow, OK | 86,765 | ±2,441 |
| Honolulu, HI | 86,504 | ±1,705 |
| New Braunfels, TX | 86,021 | ±5,404 |
| Tacoma, WA | 85,884 | ±1,903 |
| Atlanta, GA | 85,652 | ±1,846 |
| Raleigh, NC | 85,395 | ±2,159 |
| Pembroke Pines, FL | 85,104 | ±5,341 |
| Fort Collins, CO | 85,070 | ±2,468 |
| Colorado Springs, CO | 84,818 | ±1,638 |
| Santa Maria, CA | 84,746 | ±4,196 |
| Boise, ID | 83,904 | ±2,392 |
| Yonkers, NY | 83,549 | ±3,929 |
| Everett, WA | 83,512 | ±2,953 |
| Fort Lauderdale, FL | 83,130 | ±3,345 |
| Mesa, AZ | 82,752 | ±1,662 |
| South Fulton, GA | 82,324 | ±7,275 |
| Ann Arbor, MI | 82,212 | ±5,268 |
| Charlotte, NC | 82,068 | ±1,299 |
| Visalia, CA | 81,989 | ±3,274 |
| Los Angeles, CA | 81,939 | ±742 |
| Irving, TX | 81,830 | ±2,433 |
| Palmdale, CA | 81,770 | ±2,952 |
| Durham, NC | 81,619 | ±2,203 |
| Grand Prairie, TX | 81,619 | ±3,114 |
| Lancaster, CA | 81,511 | ±3,094 |
| Vancouver, WA | 81,338 | ±1,531 |
| Phoenix, AZ | 81,332 | ±986 |
| Manchester, NH | 81,007 | ±1,990 |
| Minneapolis, MN | 80,846 | ±1,824 |
| Reno, NV | 80,760 | ±2,418 |
| United States | 80,734 | ±166 |
| Port St. Lucie, FL | 80,648 | ±2,686 |
| Bakersfield, CA | 80,540 | ±2,119 |
| New York, NY | 80,483 | ±601 |
| Brockton, MA | 80,115 | ±2,930 |
| Murfreesboro, TN | 80,108 | ±2,209 |
| Sterling Heights, MI | 79,909 | ±3,056 |
| Stockton, CA | 79,907 | ±2,147 |
| Modesto, CA | 79,891 | ±1,825 |
| Tempe, AZ | 79,663 | ±2,503 |
| North Las Vegas, NV | 79,542 | ±2,083 |
| Fort Worth, TX | 79,507 | ±966 |
| Pomona, CA | 79,479 | ±3,248 |
| Lowell, MA | 78,658 | ±3,823 |
| Cape Coral, FL | 78,104 | ±2,925 |
| Madison, WI | 78,050 | ±2,037 |
| Chicago, IL | 77,902 | ±907 |
| Gresham, OR | 77,795 | ±3,707 |
| Nashville, TN | 77,371 | ±1,378 |
| St. George, UT | 76,508 | ±4,339 |
| Garland, TX | 76,320 | ±2,111 |
| Conroe, TX | 76,206 | ±4,020 |
| Denton, TX | 76,019 | ±3,990 |
| Sioux Falls, SD | 75,970 | ±2,280 |
| Salem, OR | 75,487 | ±2,354 |
| Tampa, FL | 75,475 | ±1,872 |
| St. Petersburg, FL | 75,192 | ±1,875 |
| Arlington, TX | 75,171 | ±1,543 |
| Salt Lake City, UT | 75,090 | ±2,663 |
| Lynn, MA | 75,043 | ±3,246 |
| Huntsville, AL | 74,714 | ±2,263 |
| Victorville, CA | 74,410 | ±3,243 |
| Nampa, ID | 74,279 | ±2,044 |
| Spokane Valley, WA | 74,042 | ±2,587 |
| Las Vegas, NV | 73,877 | ±1,306 |
| Billings, MT | 73,712 | ±3,113 |
| Glendale, AZ | 73,530 | ±2,167 |
| Odessa, TX | 73,472 | ±4,154 |
| West Palm Beach, FL | 73,446 | ±2,790 |
| St. Paul, MN | 73,394 | ±1,673 |
| Omaha, NE | 73,201 | ±1,372 |
| Inglewood, CA | 72,750 | ±3,674 |
| Palm Bay, FL | 72,614 | ±3,753 |
| Mesquite, TX | 72,537 | ±2,899 |
| Orlando, FL | 72,336 | ±2,211 |
| Hesperia, CA | 72,160 | ±4,601 |
| Lincoln, NE | 71,867 | ±1,734 |
| Fresno, CA | 70,991 | ±1,896 |
| Dallas, TX | 70,518 | ±817 |
| Cedar Rapids, IA | 70,424 | ±2,281 |
| Worcester, MA | 70,102 | ±2,389 |
| Spokane, WA | 70,064 | ±1,594 |
| Greeley, CO | 69,881 | ±2,819 |
| Jacksonville, FL | 69,872 | ±1,200 |
| Newport News, VA | 69,634 | ±2,426 |
| Hampton, VA | 69,621 | ±2,291 |
| Lexington, KY | 69,479 | ±1,691 |
| Clarksville, TN | 69,303 | ±1,681 |
| Kansas City, MO | 69,166 | ±1,445 |
| Grand Rapids, MI | 69,108 | ±1,869 |
| Oklahoma City, OK | 68,656 | ±1,466 |
| Albuquerque, NM | 68,317 | ±1,677 |
| Providence, RI | 68,119 | ±2,678 |
| El Monte, CA | 68,030 | ±2,580 |
| Norman, OK | 67,704 | ±3,898 |
| El Cajon, CA | 67,511 | ±4,257 |
| Tyler, TX | 67,486 | ±3,344 |
| San Bernardino, CA | 67,415 | ±2,803 |
| Corpus Christi, TX | 67,394 | ±1,835 |
| Hollywood, FL | 67,203 | ±2,793 |
| Pompano Beach, FL | 67,195 | ±2,295 |
| Fargo, ND | 66,998 | ±2,732 |
| Chico, CA | 66,977 | ±3,319 |
| Louisville, KY | 66,849 | ±1,523 |
| Wilmington, NC | 66,738 | ±2,914 |
| Eugene, OR | 66,562 | ±2,212 |
| Elizabeth, NJ | 66,555 | ±3,270 |
| Columbia, MO | 66,498 | ±1,794 |
| Clearwater, FL | 66,381 | ±2,396 |
| Indianapolis, IN | 66,219 | ±993 |
| Green Bay, WI | 66,206 | ±2,083 |
| Davenport, IA | 66,200 | ±1,883 |
| Norfolk, VA | 66,109 | ±1,785 |
| Columbus, OH | 66,082 | ±974 |
| Springfield, IL | 66,064 | ±3,378 |
| Des Moines, IA | 65,932 | ±1,922 |
| Amarillo, TX | 65,912 | ±1,473 |
| Pittsburgh, PA | 65,742 | ±1,484 |
| Yuma, AZ | 65,482 | ±3,394 |
| Dearborn, MI | 65,324 | ±3,496 |
| San Antonio, TX | 65,056 | ±776 |
| Pasadena, TX | 64,927 | ±3,020 |
| Houston, TX | 64,813 | ±822 |
| Wichita, KS | 64,620 | ±1,440 |
| Richmond, VA | 64,587 | ±1,911 |
| High Point, NC | 64,561 | ±4,028 |
| Chattanooga, TN | 64,523 | ±1,964 |
| Lakeland, FL | 64,185 | ±2,146 |
| Provo, UT | 64,171 | ±2,463 |
| Warren, MI | 64,016 | ±2,638 |
| Laredo, TX | 63,915 | ±2,518 |
| Miami Gardens, FL | 63,627 | ±1,785 |
| Little Rock, AR | 63,003 | ±2,303 |
| North Charleston, SC | 62,956 | ±3,840 |
| Abilene, TX | 62,648 | ±2,072 |
| Miami, FL | 62,462 | ±1,757 |
| Kansas City, KS | 62,401 | ±1,656 |
| Baltimore, MD | 62,177 | ±1,378 |
| Albany, NY | 61,986 | ±2,652 |
| Philadelphia, PA | 61,953 | ±919 |
| Lafayette, LA | 61,915 | ±2,564 |
| McAllen, TX | 61,579 | ±2,258 |
| Greensboro, NC | 61,515 | ±1,510 |
| Fort Wayne, IN | 61,422 | ±1,204 |
| Killeen, TX | 60,977 | ±1,928 |
| Lubbock, TX | 60,895 | ±1,870 |
| Independence, MO | 60,339 | ±2,199 |
| Wichita Falls, TX | 60,177 | ±2,678 |
| Tulsa, OK | 59,838 | ±961 |
| El Paso, TX | 59,745 | ±1,347 |
| Edinburg, TX | 59,466 | ±3,555 |
| Peoria, IL | 59,410 | ±2,144 |
| Winston-Salem, NC | 59,268 | ±1,883 |
| Bridgeport, CT | 58,685 | ±1,978 |
| Fayetteville, NC | 58,407 | ±1,606 |
| Columbus, GA | 58,073 | ±1,832 |
| Tallahassee, FL | 57,409 | ±2,189 |
| Savannah, GA | 57,137 | ±1,715 |
| Tucson, AZ | 57,073 | ±944 |
| Beaumont, TX | 56,997 | ±2,708 |
| New Bedford, MA | 56,981 | ±3,070 |
| Topeka, KS | 56,956 | ±1,954 |
| New Haven, CT | 56,851 | ±4,254 |
| Montgomery, AL | 56,811 | ±2,312 |
| Pueblo, CO | 56,664 | ±2,076 |
| New Orleans, LA | 56,631 | ±1,781 |
| St. Louis, MO | 56,160 | ±1,305 |
| Paterson, NJ | 55,997 | ±3,427 |
| South Bend, IN | 55,786 | ±1,639 |
| Hialeah, FL | 55,594 | ±1,624 |
| Columbia, SC | 55,529 | ±1,827 |
| Allentown, PA | 55,494 | ±2,358 |
| Augusta, GA | 55,485 | ±2,918 |
| Las Cruces, NM | 55,422 | ±3,044 |
| Rockford, IL | 54,752 | ±2,248 |
| Lansing, MI | 54,382 | ±1,938 |
| Waco, TX | 54,365 | ±2,349 |
| Milwaukee, WI | 54,234 | ±1,283 |
| Knoxville, TN | 54,039 | ±1,606 |
| Mobile, AL | 53,558 | ±1,982 |
| Evansville, IN | 53,387 | ±1,841 |
| Athens, GA | 52,974 | ±2,410 |
| Cincinnati, OH | 52,909 | ±1,946 |
| Springfield, MA | 52,656 | ±2,452 |
| Brownsville, TX | 52,130 | ±2,503 |
| Newark, NJ | 52,060 | ±1,772 |
| Waterbury, CT | 51,886 | ±2,278 |
| Memphis, TN | 51,736 | ±1,072 |
| Tuscaloosa, AL | 51,464 | ±2,918 |
| Macon, GA | 51,234 | ±2,220 |
| College Station, TX | 50,900 | ±2,400 |
| Buffalo, NY | 50,041 | ±1,988 |
| Baton Rouge, LA | 49,994 | ±2,546 |
| Toledo, OH | 49,724 | ±993 |
| Springfield, MO | 49,311 | ±1,276 |
| Shreveport, LA | 48,699 | ±1,652 |
| Akron, OH | 48,076 | ±1,702 |
| Syracuse, NY | 47,819 | ±2,145 |
| Rochester, NY | 47,213 | ±1,632 |
| Hartford, CT | 46,411 | ±3,031 |
| Gainesville, FL | 46,195 | ±2,205 |
| Birmingham, AL | 46,051 | ±1,718 |
| Dayton, OH | 45,247 | ±1,703 |
| Jackson, MS | 42,071 | ±1,821 |
| Cleveland, OH | 40,801 | ±1,054 |
| Detroit, MI | 39,938 | ±937 |
Get new charts weekly
One email a week with the newest charts and their key numbers. No account needed.
More Income and poverty charts
-
What share of people live in poverty in your county?
Search any of the 3,144 U.S. counties. In the Census Bureau's five-year survey ending in 2024, Oglala Lakota County, South Dakota had the highest share of pe...
Source: U.S. Census Bureau, American Community Survey 5-year estimates · Data as of Dec 31, 2024
-
What share of people live in poverty in each state?
In the Census Bureau's five-year survey ending in 2024, 12.5% of people in the U.S. lived below the official poverty line. Louisiana (18.9%) and Mississippi ...
Source: U.S. Census Bureau, American Community Survey 5-year estimates · Data as of Dec 31, 2024
-
What is the typical household income in each state?
In the Census Bureau's 5-year survey ending in 2024, the typical household in District of Columbia earned $109,870 a year, the most, followed by Massachusett...
Source: U.S. Census Bureau, American Community Survey 5-year estimates · Data as of Dec 31, 2024
-
What is the typical household income in your county?
Search any of the 3,143 U.S. counties. In the Census Bureau's 5-year survey ending in 2024, Loudoun County, Virginia, had the highest median household income...
Source: U.S. Census Bureau, American Community Survey 5-year estimates · Data as of Dec 31, 2024