Which college football conference wins the most games against other conferences?
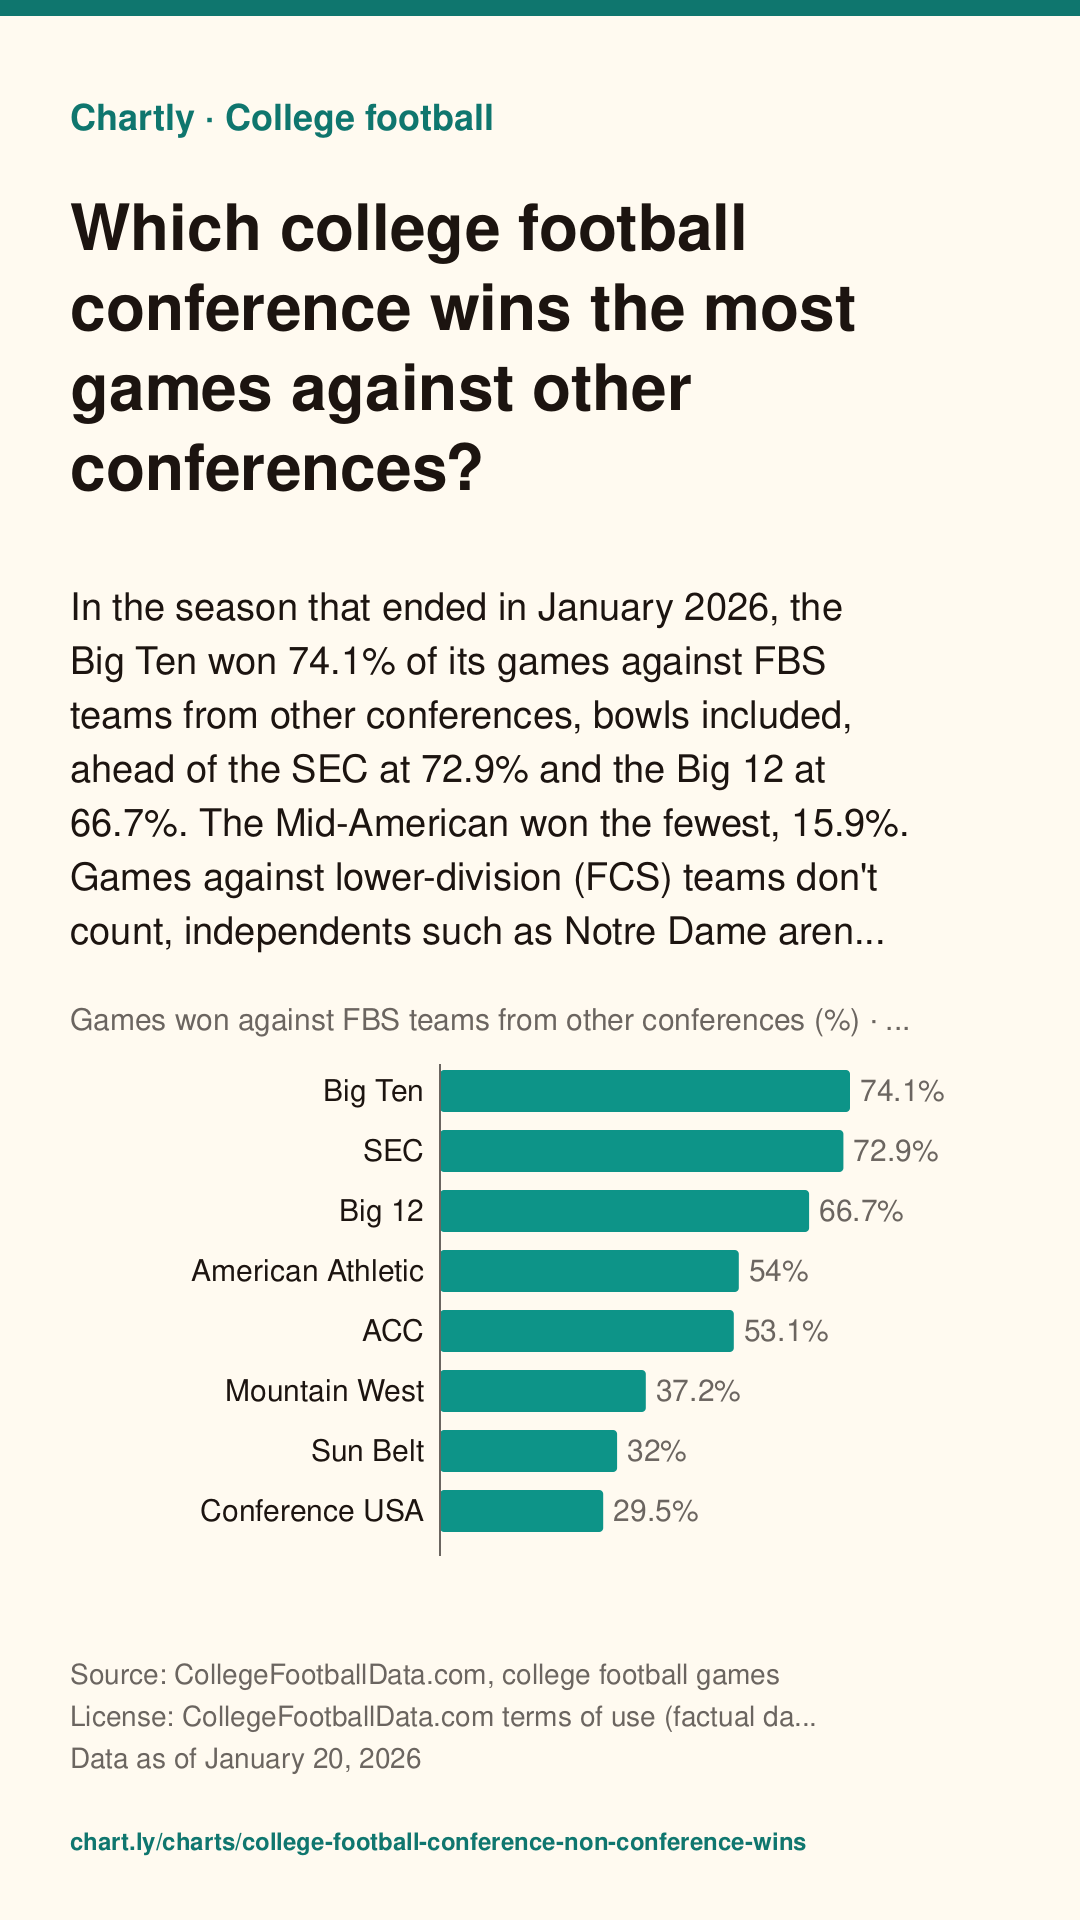
In the season that ended in January 2026, the Big Ten won 74.1% of its games against FBS teams from other conferences, bowls included, ahead of the SEC at 72.9% and the Big 12 at 66.7%. The Mid-American won the fewest, 15.9%. Games against lower-division (FCS) teams don't count, independents such as Notre Dame aren't a conference, and conferences with fewer than 6 FBS teams that season, such as the Pac-12 in 2024 and 2025, are left out.
The interactive chart needs JavaScript. The numbers are in the table below.
The value axis starts at zero. Hover, tap or use the arrow keys to read exact values.
Save a simple drawing of this chart for slides, essays or posts, with its question, source, date and a link back to this page. Please keep the credit.
Download image
A tall picture for Pinterest or an Instagram story, with the question, answer, source, date and this page's address.
Chartly Pro: downloads and embeds without the credit. Join the waitlist
It doesn't exist yet. Tell us what you'd use it for, and we'll email you once when it's ready. Downloads and embeds with the credit stay free.
Key facts
Measure: Games won against FBS teams from other conferences (%). Written from the data below.
- Big Ten has the highest figure, 74.1%, followed by SEC (72.9%) and Big 12 (66.7%).
- Mid-American has the lowest figure, 15.9%, followed by Conference USA (29.5%) and Sun Belt (32%).
- The highest is 4.7 times the lowest.
Teachers: add this chart to a class assignment, one link to post in Google Classroom, Canvas or Moodle.
Source and date
- Data as of
- Published
Citation
Chartly. “Which college football conference wins the most games against other conferences?” Chart. Data: CollegeFootballData.com, college football games, https://collegefootballdata.com/ (data as of January 20, 2026). https://chart.ly/charts/college-football-conference-non-conference-wins (accessed November 5, 2026).
Free for your article, blog or class page: paste this code where the chart should go. It shows the interactive chart with its source and a small “Chart by Chartly” credit, and stays up to date when the data changes. Need it without the credit? Join the Chartly Pro waitlist.
The data
Download data (CSV)The file has the numbers in this table, with the source, license and date. Please credit the source and Chartly.
| Conference | Games won against FBS teams from other conferences (%) |
|---|---|
| Big Ten | 74.1 |
| SEC | 72.9 |
| Big 12 | 66.7 |
| American Athletic | 54 |
| ACC | 53.1 |
| Mountain West | 37.2 |
| Sun Belt | 32 |
| Conference USA | 29.5 |
| Mid-American | 15.9 |
Get new charts weekly
One email a week with the newest charts and their key numbers. No account needed.
More College football charts
-
How many college football games are decided by one score?
36.6% of regular-season games between two FBS (top-division) teams in 2025 were decided by 8 points or fewer, what a touchdown and a two-point conversion can...
Source: CollegeFootballData.com, college football games · Data as of Jan 20, 2026
-
Who leads college football's most-played rivalries?
Of the 20 most-played rivalries between teams now in the FBS, the most one-sided is Tennessee over Kentucky: the leader has won 75.0% of their games in Colle...
Source: CollegeFootballData.com, college football games · Data as of Jan 20, 2026
-
How often do ranked college football teams lose to unranked teams?
Unranked FBS teams won 19.7% of their games against AP Top 25 teams in 2025. The share has ranged from 4.5% in 1998 to 25.9% in 2007, and has usually been hi...
Source: CollegeFootballData.com, college football games and AP Top 25 polls · Data as of Jan 20, 2026
-
How many points does a college football team score per game?
A college football team scored 26.2 points a game on average in 2025, in regular-season games between two FBS (top-division) teams, up from 9.8 in 1900. Scor...
Source: CollegeFootballData.com, college football games · Data as of Jan 20, 2026