The teacher's answer key. Students' scales may differ; any even scale that starts at 0 and fits the biggest number is right.
Answer key · graphing practice
Draw a line graph: world population
A title such as "How has the world's population grown since 1960?". Bottom axis: Year. Side axis: People, in billions, from 0 to 10, going up by 1 on each dark line.
| Year | People, in billions |
|---|---|
| 1965 | 3.32 |
| 1975 | 4.06 |
| 1985 | 4.85 |
| 1995 | 5.74 |
| 2005 | 6.58 |
| 2015 | 7.44 |
| 2025 | 8.22 |
Every few years from the chart, ending with the newest. Numbers are rounded to make them easier to plot. Source: World Bank, World Development Indicators: Population, total (CC BY 4.0 (credit the World Bank)) · Data as of Dec 31, 2025
The finished Chartly chart
Every number the source has, not only the table's rows.
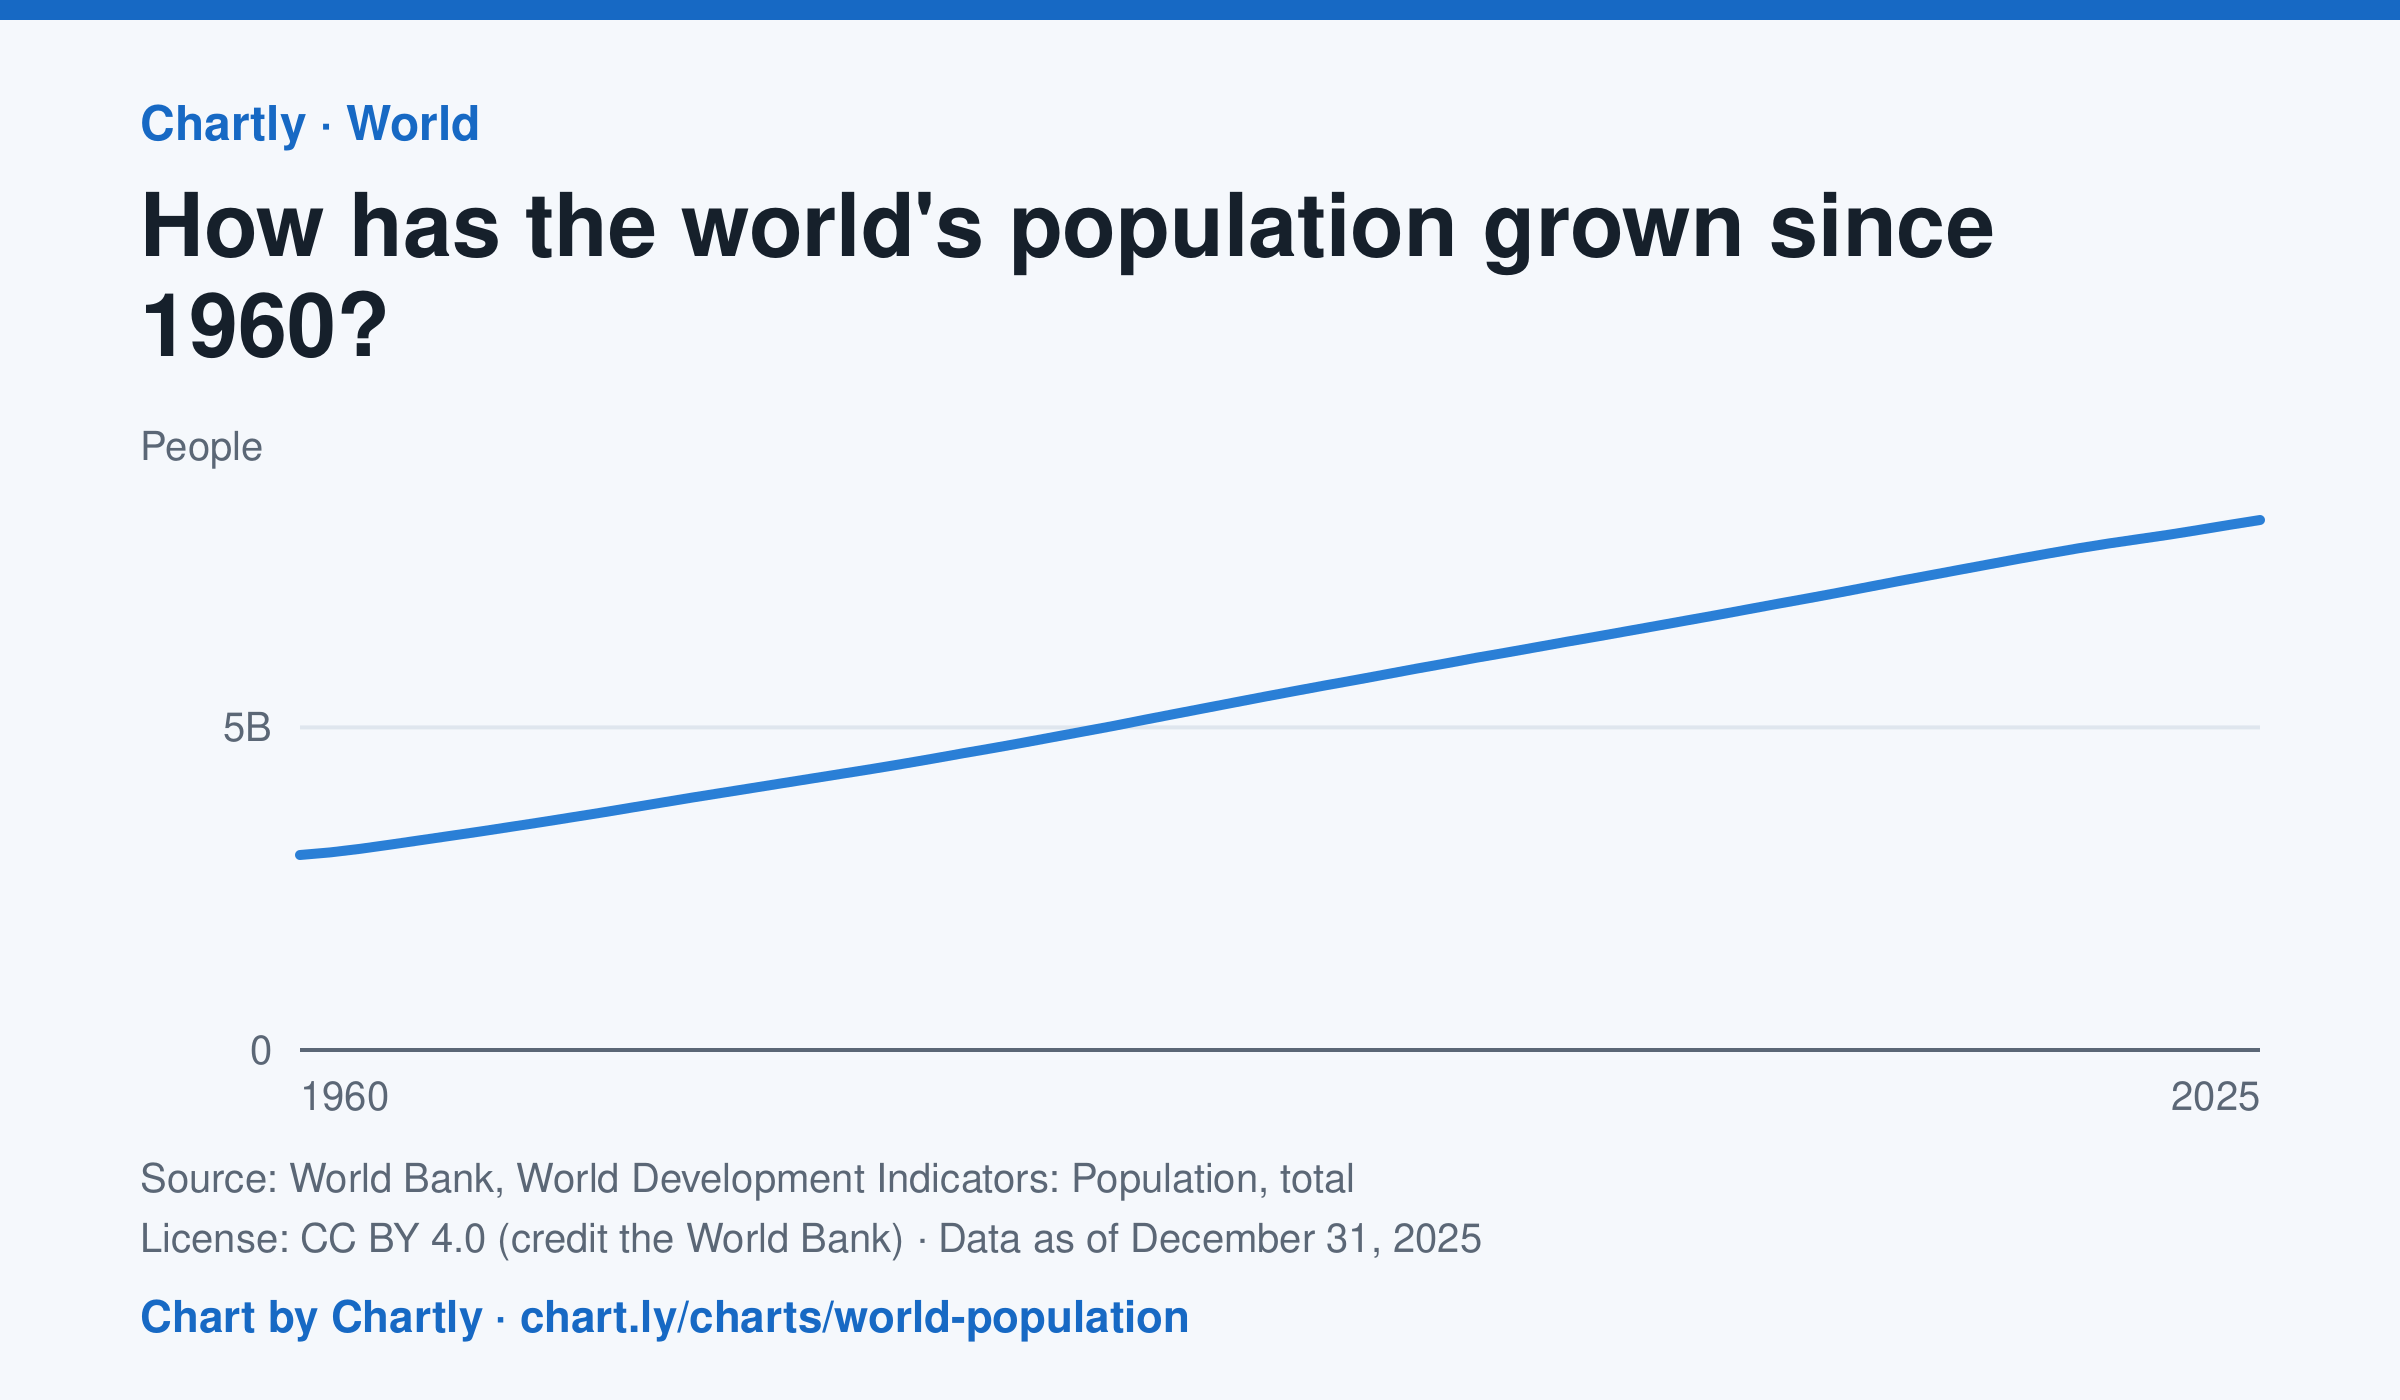
The world had 8.22 billion people in 2025, about 2.7 times the 3.02 billion of 1960. It passed 8 billion in 2023. Figures are mid-year estimates from the United Nations, which revises them as new censuses come in.
Chart and numbers: chart.ly/charts/world-population · Source: World Bank, World Development Indicators: Population, total (CC BY 4.0 (credit the World Bank)) · Data as of Dec 31, 2025