The teacher's answer key. Students' scales may differ; any even scale that starts at 0 and fits the biggest number is right.
Answer key · graphing practice
Draw a line graph: world life expectancy
A title such as "How long do people around the world live, and how has that changed since 1960?". Bottom axis: Year. Side axis: Life expectancy at birth, years, from 0 to 100, going up by 10 on each dark line.
| Year | Life expectancy at birth, years |
|---|---|
| 1964 | 56.1 |
| 1974 | 59.7 |
| 1984 | 63.4 |
| 1994 | 66 |
| 2004 | 68.8 |
| 2014 | 71.8 |
| 2024 | 73.5 |
Every few years from the chart, ending with the newest. Numbers are rounded to make them easier to plot. Source: World Bank, World Development Indicators: Life expectancy at birth, total (years) (CC BY 4.0 (credit the World Bank)) · Data as of Dec 31, 2024
The finished Chartly chart
Every number the source has, not only the table's rows.
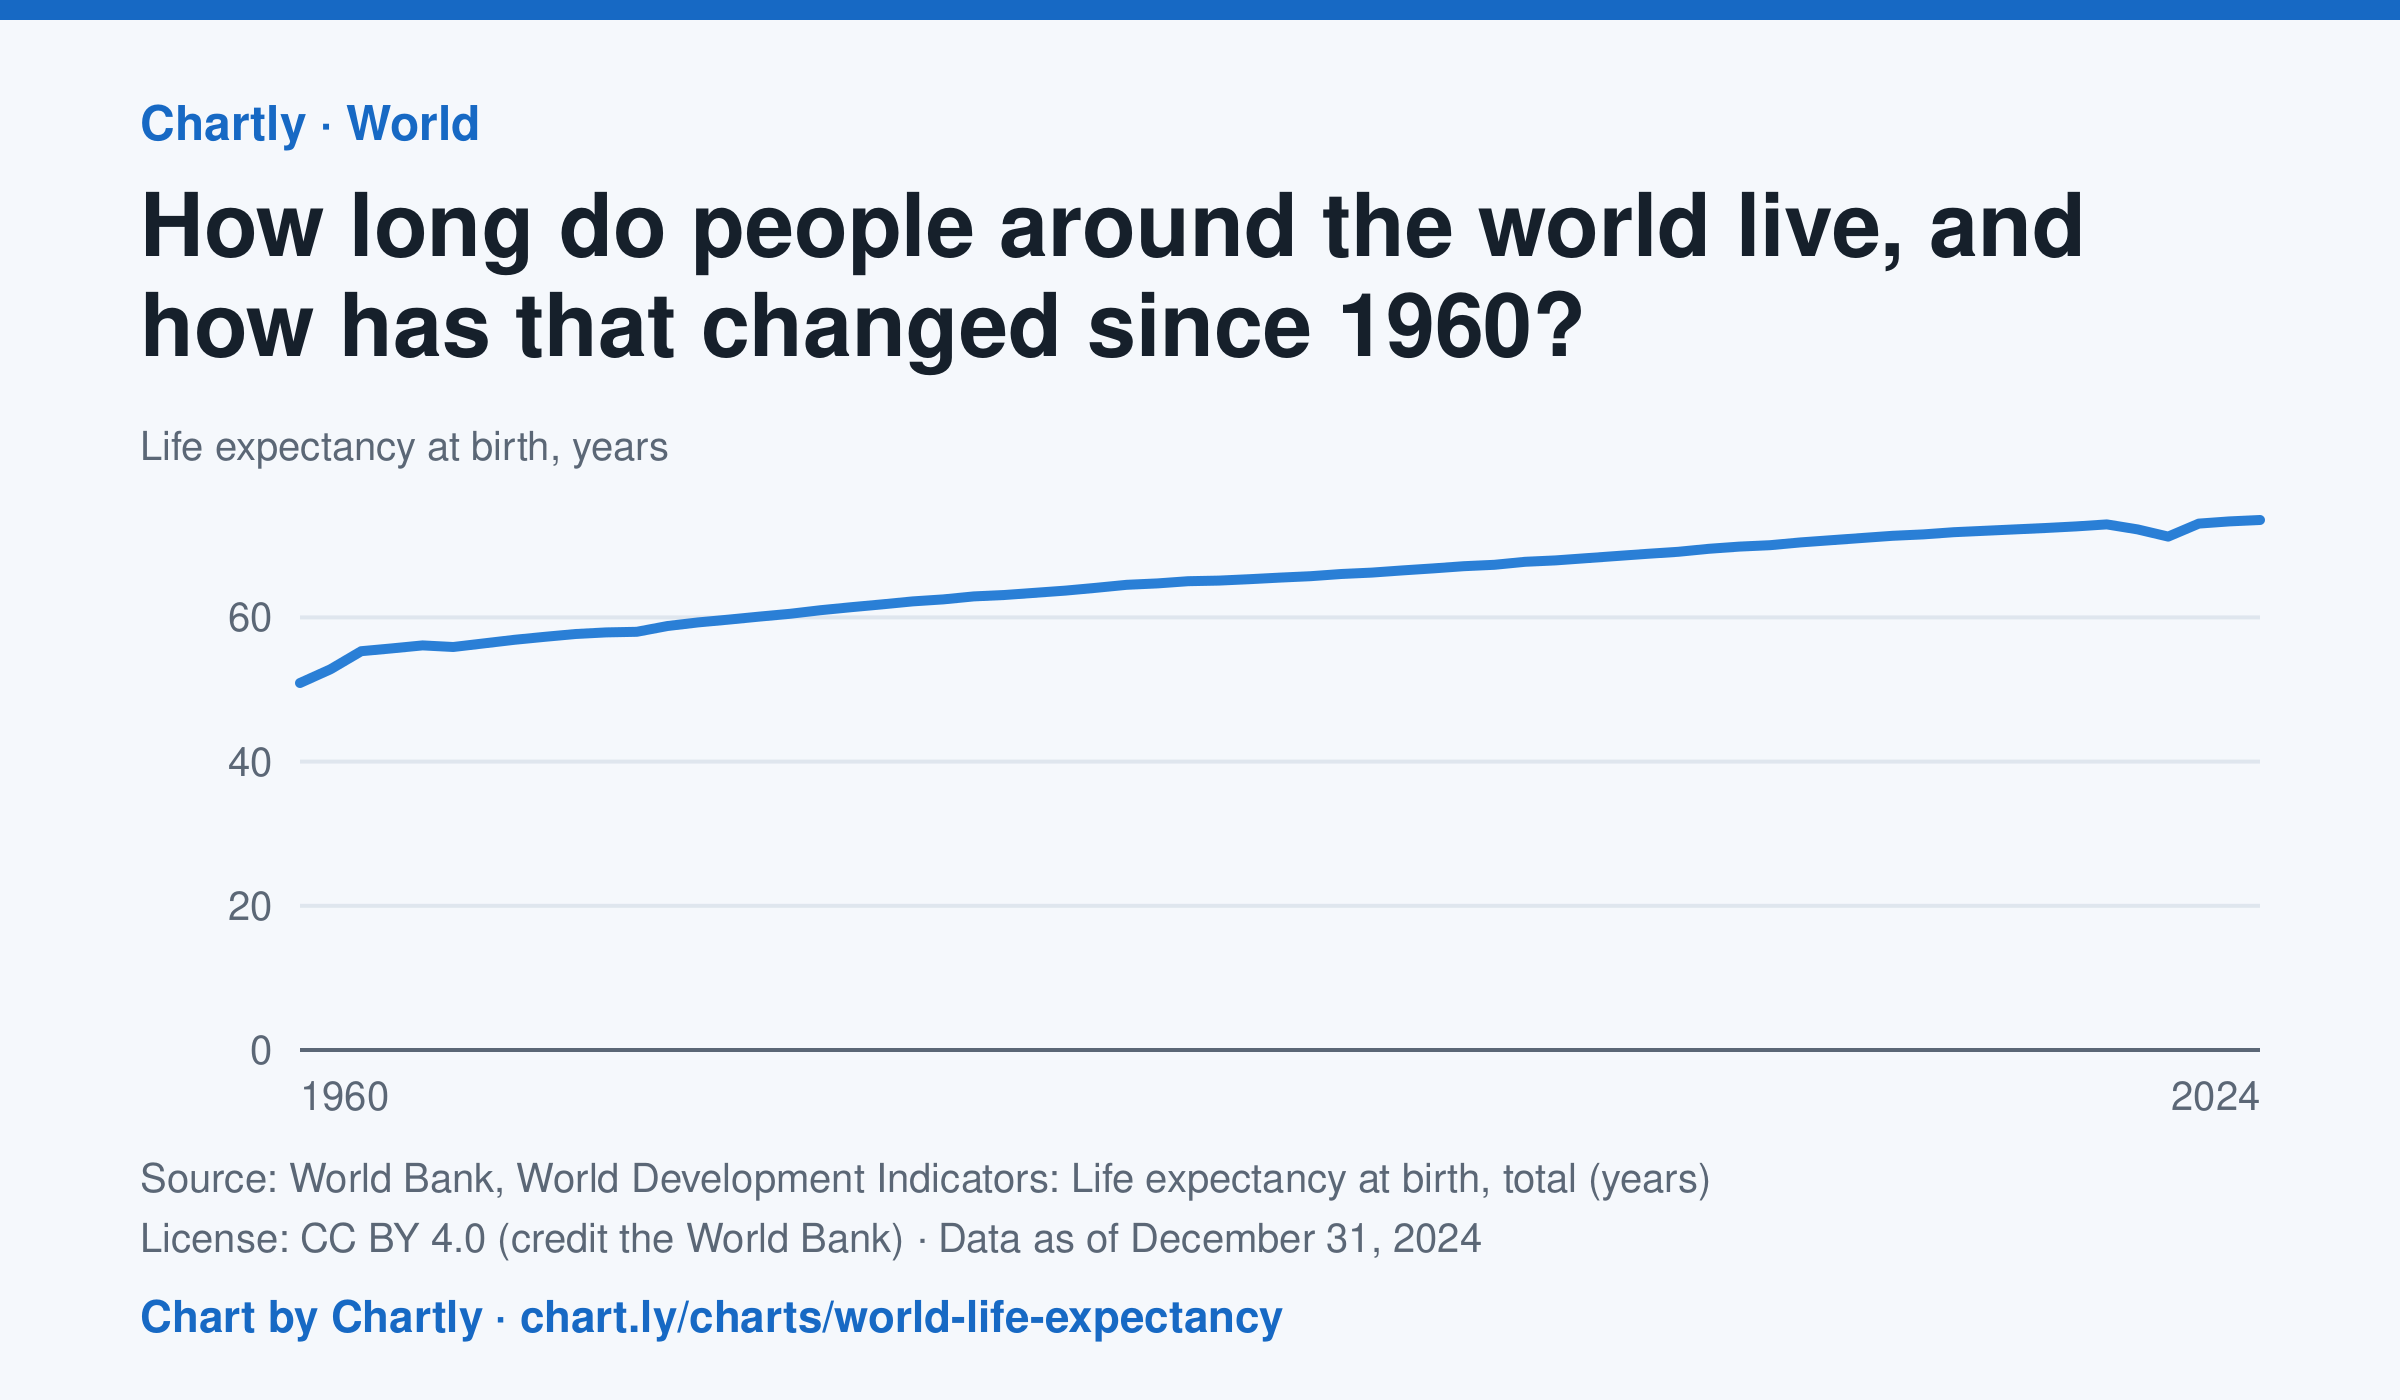
A baby born in 2024 could expect to live 73.5 years on average across the world, up from 50.9 in 1960. The very low early-1960s figures include the famine in China. Life expectancy fell to 71.2 years in 2021, during the COVID-19 pandemic, then recovered. These are United Nations estimates.
Chart and numbers: chart.ly/charts/world-life-expectancy · Source: World Bank, World Development Indicators: Life expectancy at birth, total (years) (CC BY 4.0 (credit the World Bank)) · Data as of Dec 31, 2024