The teacher's answer key. Students' scales may differ; any even scale that starts at 0 and fits the biggest number is right.
Answer key · graphing practice
Draw a line graph: wind and solar energy
A title such as "How much of US electricity comes from wind and solar?". Bottom axis: Year. Side axis: Share of US electricity generation (%), from 0 to 20, going up by 2 on each dark line.
| Year | Share of US electricity generation (%) |
|---|---|
| 1950 | 0 |
| 1965 | 0 |
| 1980 | 0 |
| 1995 | 0.1 |
| 2010 | 2.3 |
| 2025 | 17.2 |
Every few years from the chart, ending with the newest. Numbers are rounded to make them easier to plot. Source: U.S. Energy Information Administration, Monthly Energy Review (Table 7.2a) (Public domain (U.S. government work)) · Data as of Dec 31, 2025
The finished Chartly chart
Every number the source has, not only the table's rows.
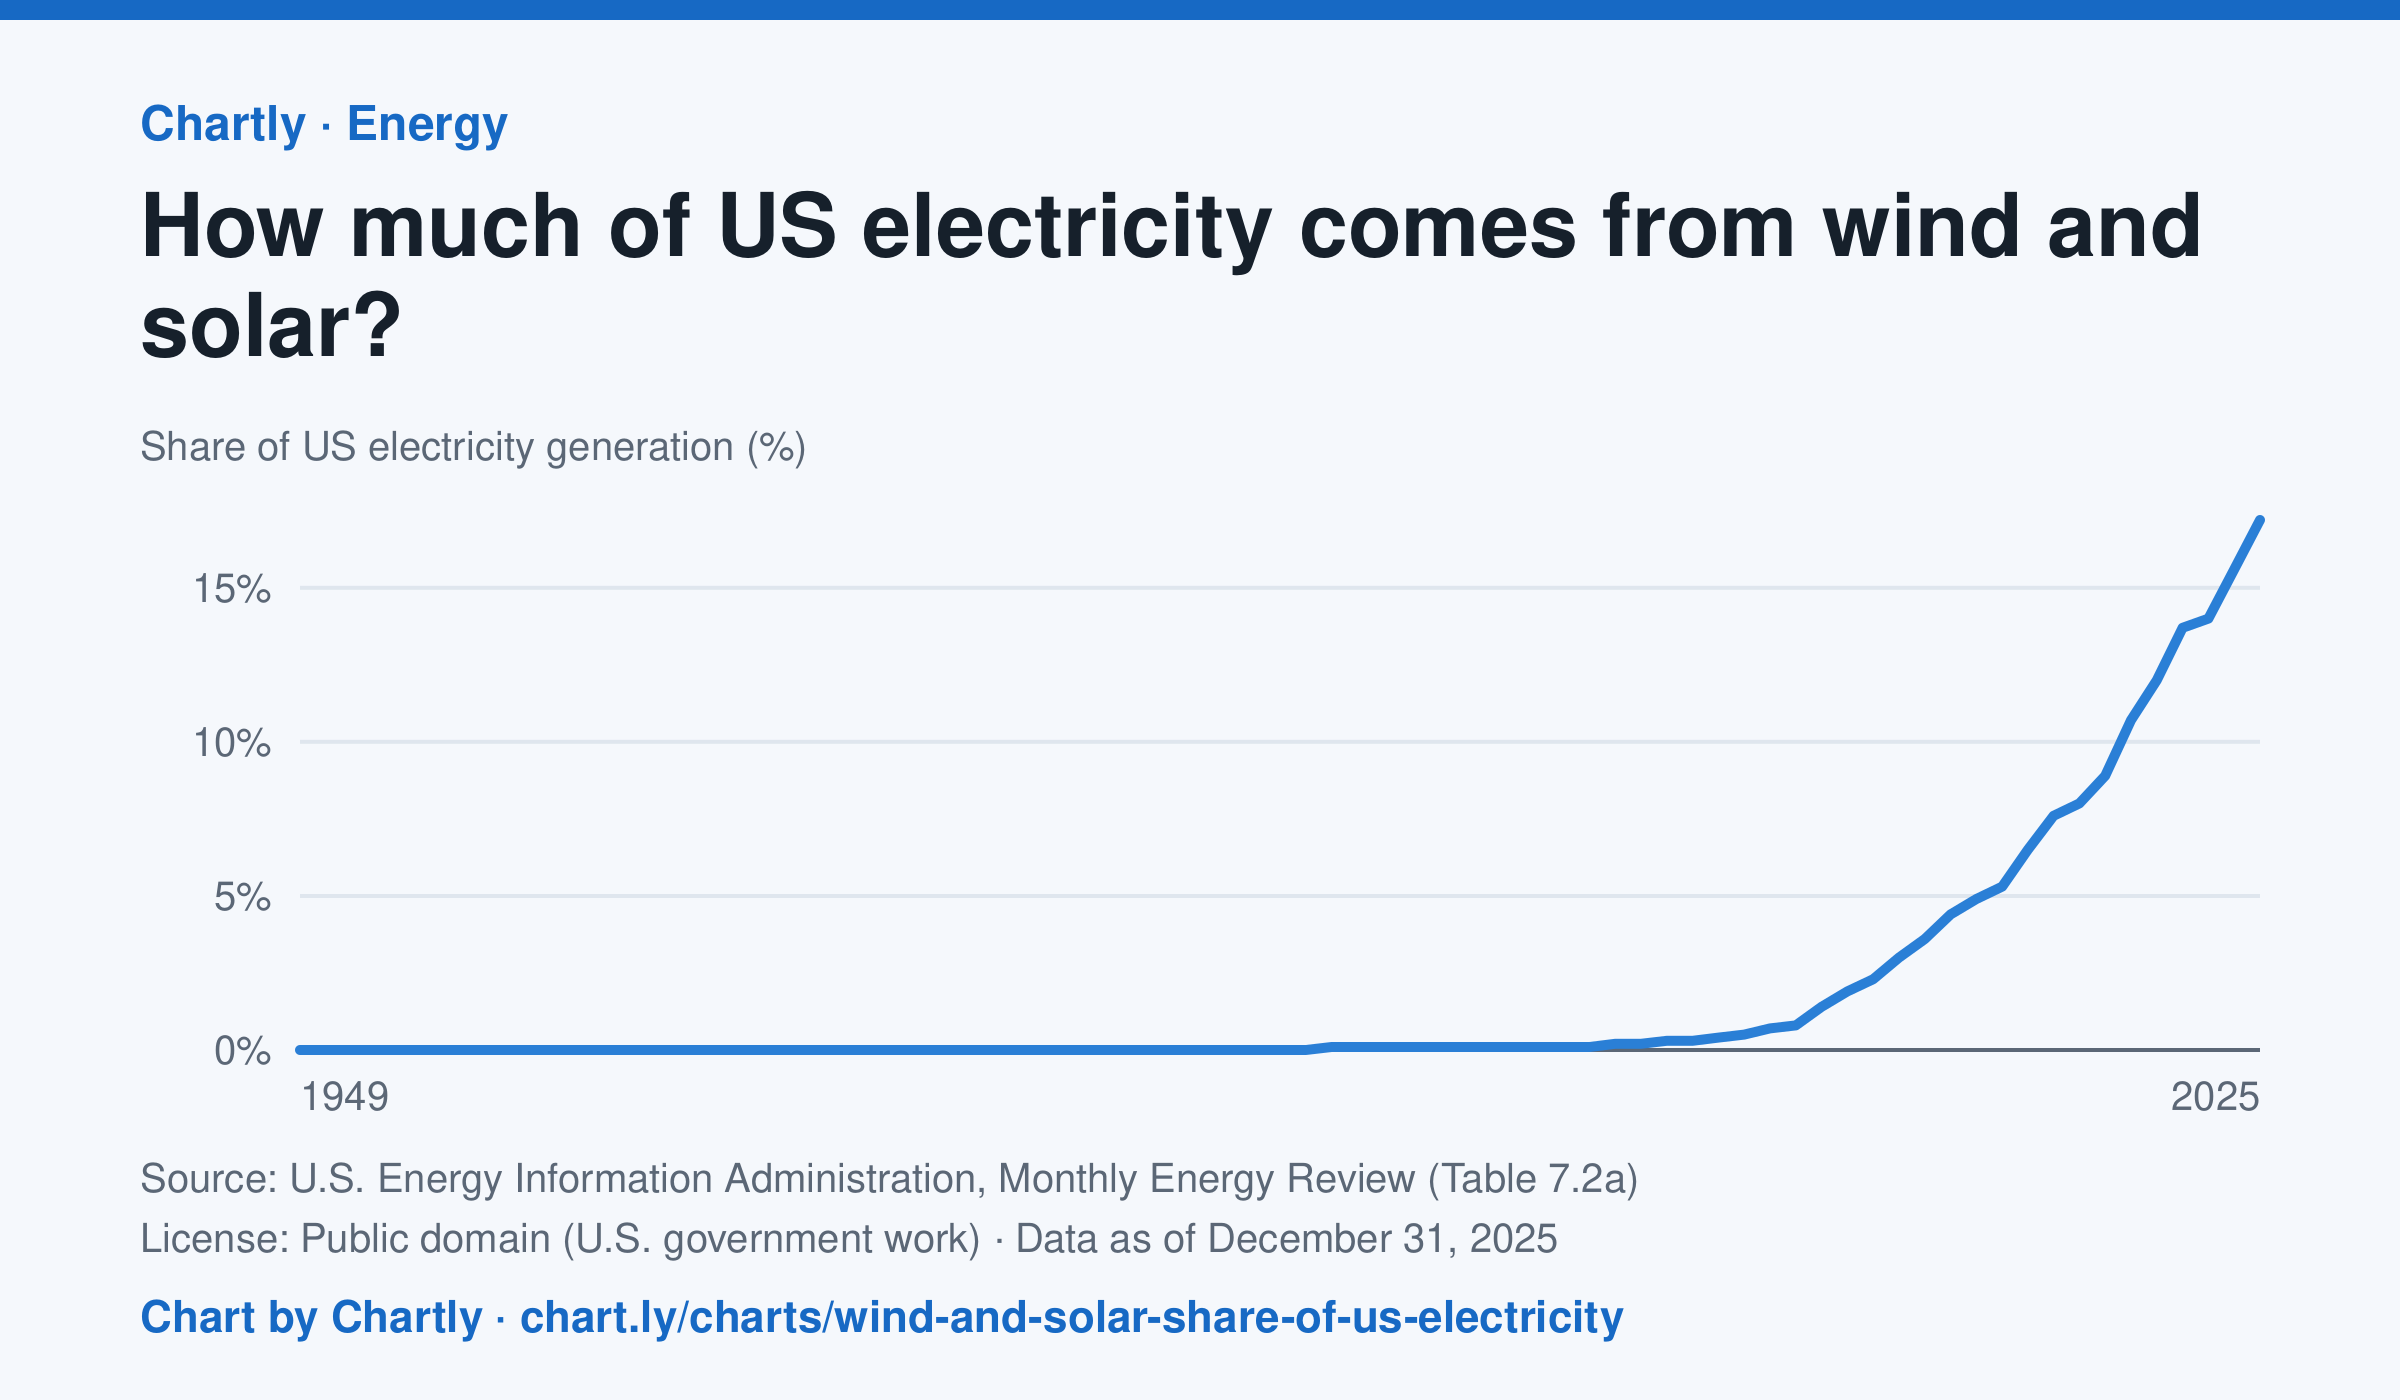
Wind and solar made 17.2% of US electricity in 2025, up from 2.3% in 2010 and under 1% through 2007. Solar counts only utility-scale plants, not rooftop panels, and the 2025 figures are preliminary.
Chart and numbers: chart.ly/charts/wind-and-solar-share-of-us-electricity · Source: U.S. Energy Information Administration, Monthly Energy Review (Table 7.2a) (Public domain (U.S. government work)) · Data as of Dec 31, 2025