The teacher's answer key. Students' scales may differ; any even scale that starts at 0 and fits the biggest number is right.
Answer key · graphing practice
Draw a bar graph: warming by state
A title such as "Which US states have warmed the most?". Bottom axis: State. Side axis: °F warmer in the last 10 years than the 1901–2000 average, from 0 to 5, going up by 0.5 on each dark line.
| State | °F warmer in the last 10 years than the 1901–2000 average |
|---|---|
| Alaska | 3.3 |
| Delaware | 3.1 |
| New Mexico | 2.7 |
| Utah | 2.6 |
| Colorado | 2.4 |
| Indiana | 2.1 |
| Illinois | 2 |
| Mississippi | 1.9 |
| Iowa | 1.8 |
| Oklahoma | 1.6 |
10 of the 49 on the chart, from the highest to the lowest. Numbers are rounded to make them easier to plot. Source: NOAA National Centers for Environmental Information, Climate at a Glance (Public domain (U.S. government work)) · Data as of Dec 31, 2025
The finished Chartly chart
Every number the source has, not only the table's rows.
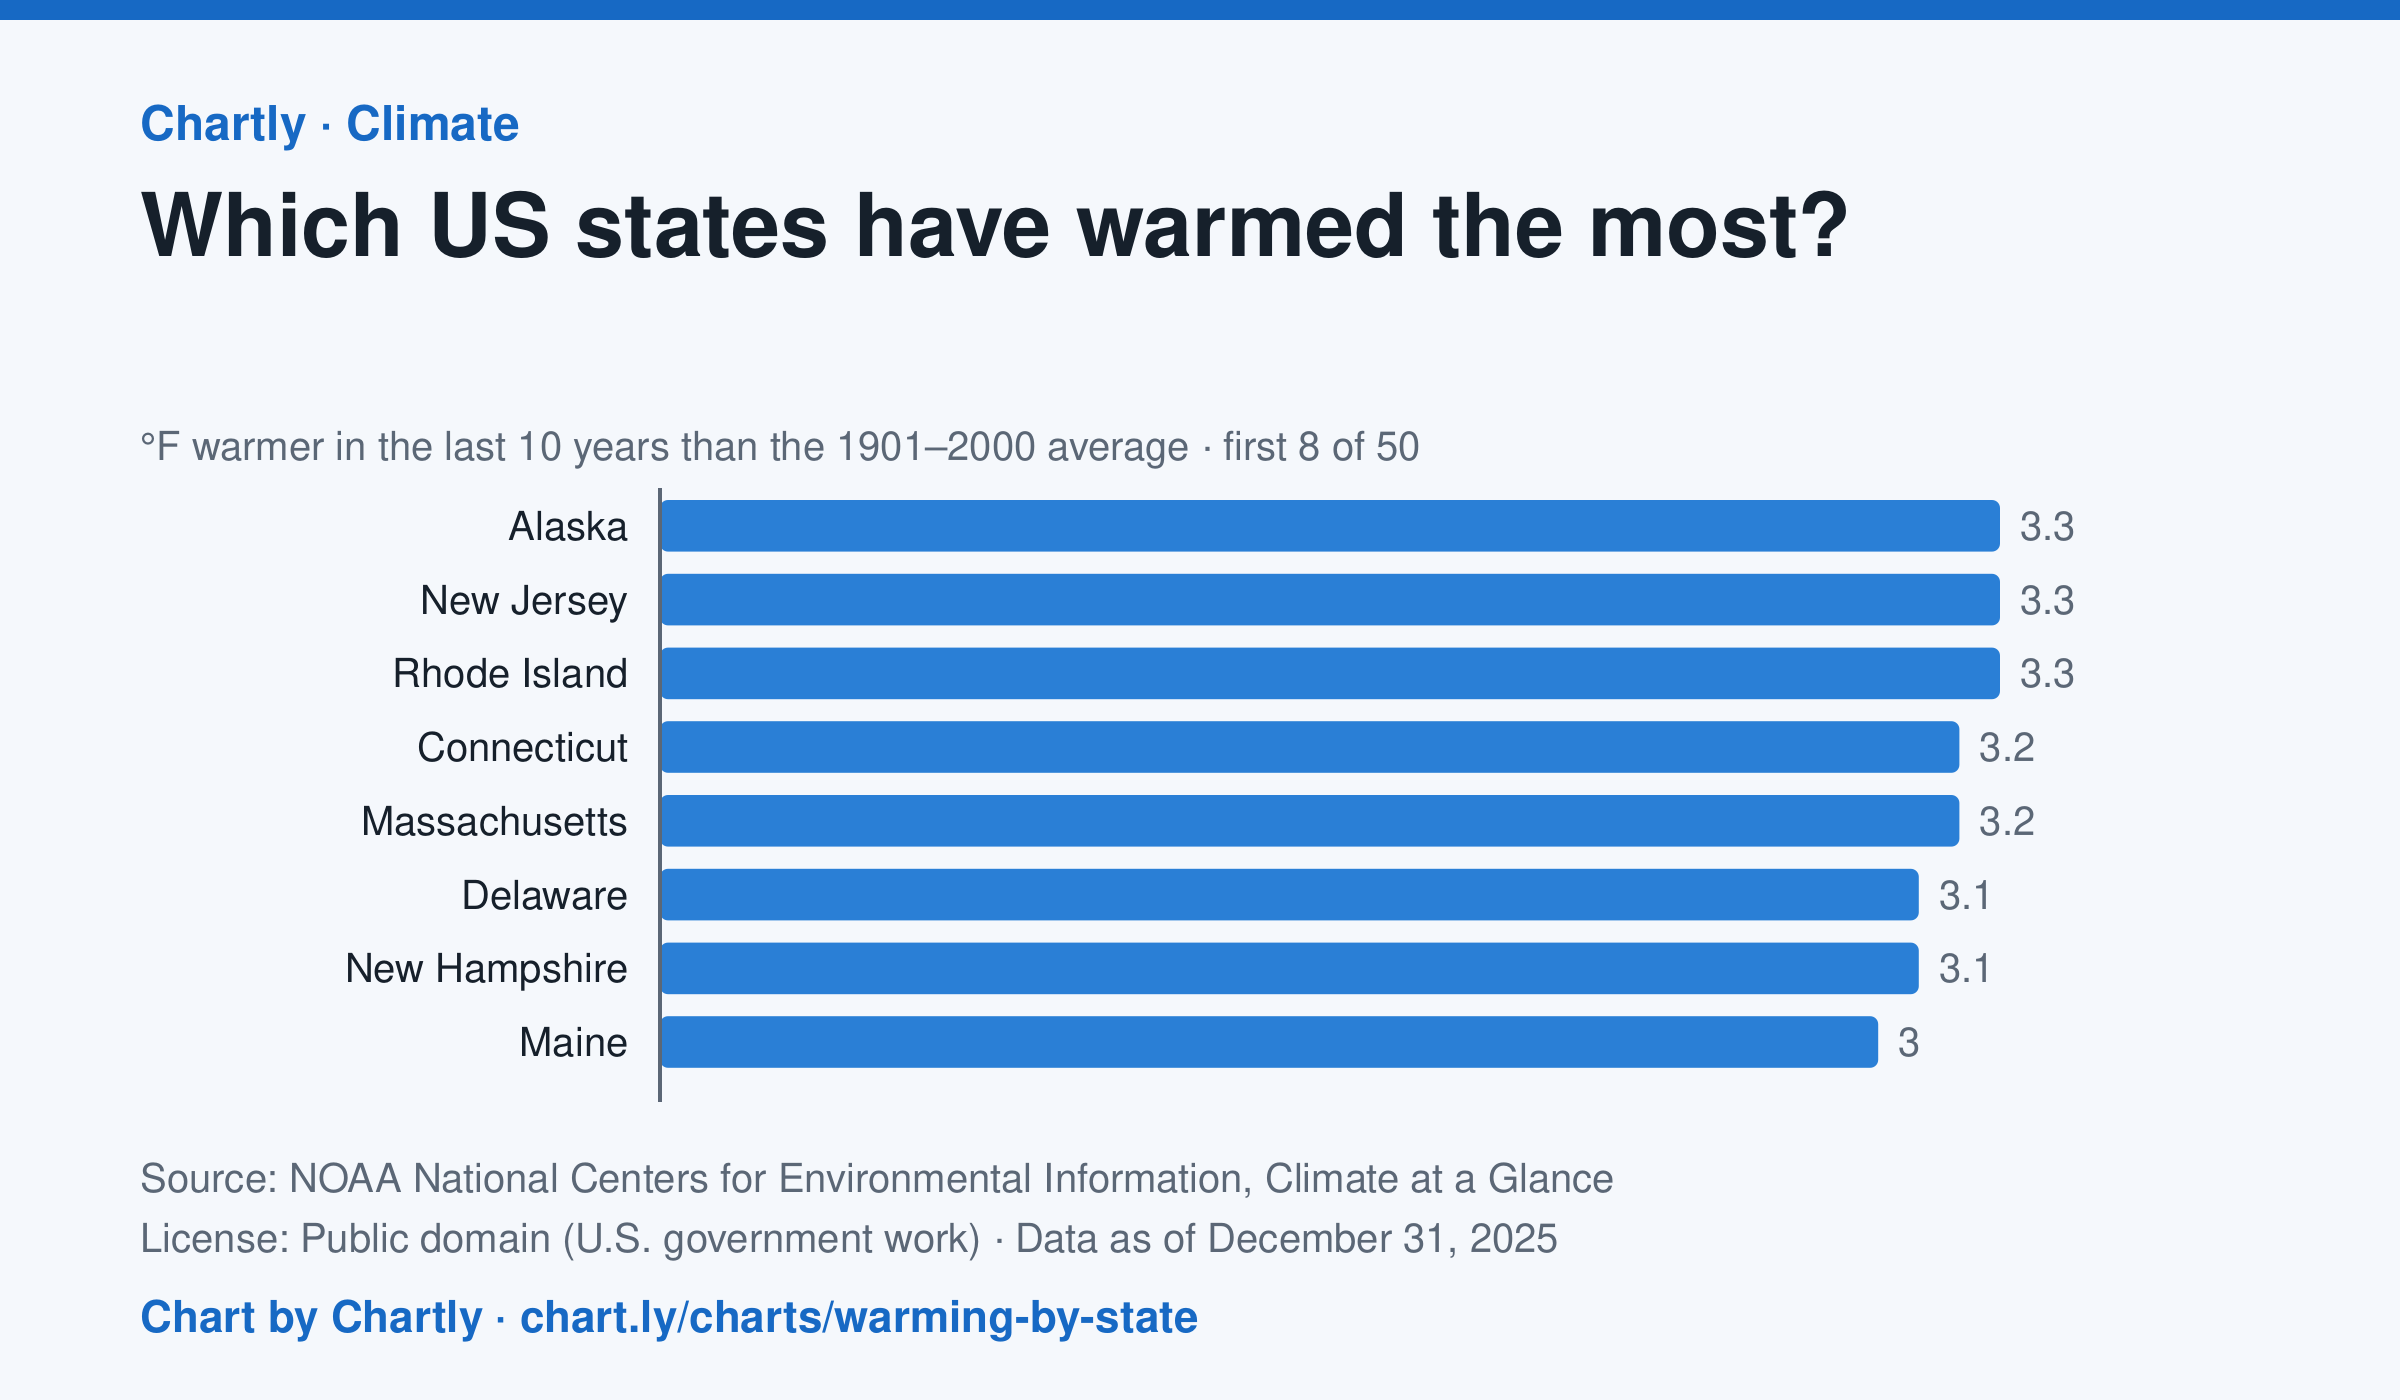
In the 10 years through 2025, Alaska was among the states that warmed most, averaging 3.3°F warmer than in 1901–2000, while Oklahoma was among those that warmed least, 1.6°F; the contiguous US warmed 2.2°F. Alaska's records start in 1925, so its baseline is 1925–2000. Hawaii's start in 1991, so it isn't included.
Chart and numbers: chart.ly/charts/warming-by-state · Source: NOAA National Centers for Environmental Information, Climate at a Glance (Public domain (U.S. government work)) · Data as of Dec 31, 2025