The teacher's answer key. Students' scales may differ; any even scale that starts at 0 and fits the biggest number is right.
Answer key · graphing practice
Draw a line graph: violent crime
A title such as "Is violent crime in the U.S. going up or down?". Bottom axis: Year. Side axis: Violent crimes per 100,000 people, from 0 to 1,000, going up by 100 on each dark line.
| Year | Violent crimes per 100,000 people |
|---|---|
| 1985 | 570 |
| 1995 | 721 |
| 2005 | 483 |
| 2015 | 385 |
| 2025 | 329 |
Every few years from the chart, ending with the newest. Numbers are rounded to make them easier to plot. Source: FBI Crime Data Explorer, Uniform Crime Reporting Program (Public domain (U.S. government work); source FBI Uniform Crime Reporting Program) · Data as of Dec 31, 2025
The finished Chartly chart
Every number the source has, not only the table's rows.
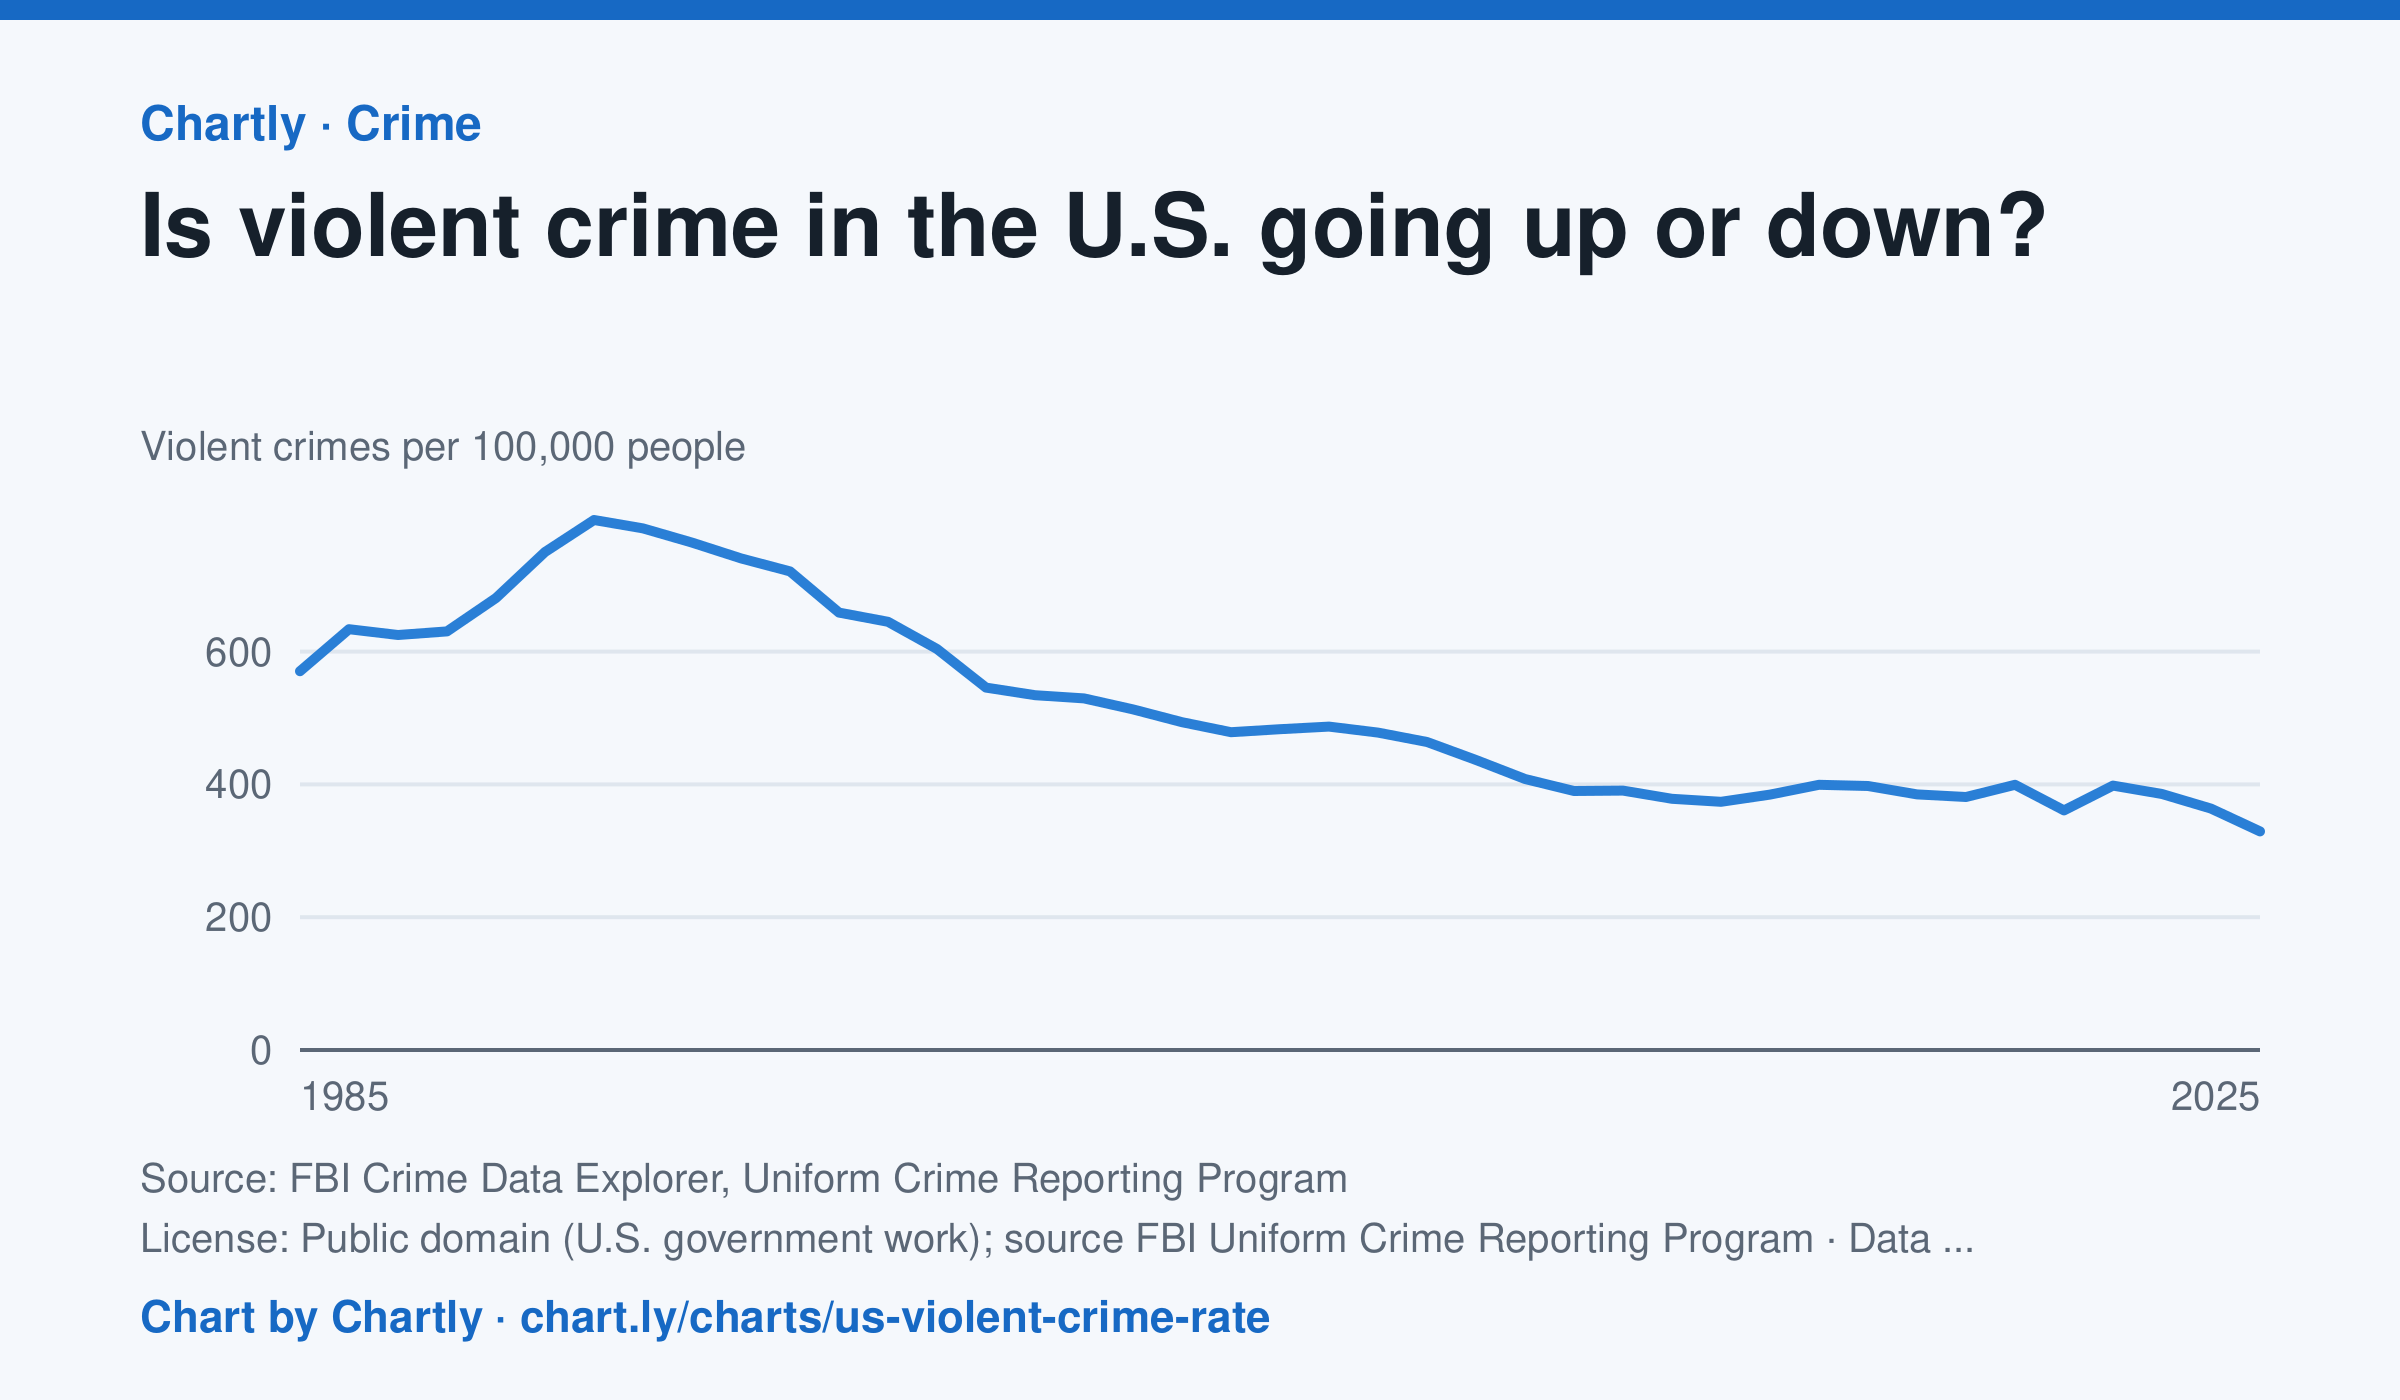
Down, over the long run. Police reported about 329 violent crimes per 100,000 people in 2025, about 59% below the 1991 peak of about 798, and the lowest since at least 1985. The rate rose in 2020 and 2022, then fell in 2023, 2024 and 2025. In 2021 the FBI stopped taking its old summary reports and accepted only its newer, more detailed system (NIBRS); many police departments hadn't switched yet, so agencies covering only about 77% of Americans reported, against 88 to 98% in other years, and 2021's number is less certain. Rates count only the agencies that reported, so they differ a little from the FBI's national estimates, and the FBI widened its definition of rape in 2013.
Chart and numbers: chart.ly/charts/us-violent-crime-rate · Source: FBI Crime Data Explorer, Uniform Crime Reporting Program (Public domain (U.S. government work); source FBI Uniform Crime Reporting Program) · Data as of Dec 31, 2025