The teacher's answer key. Students' scales may differ; any even scale that starts at 0 and fits the biggest number is right.
Answer key · graphing practice
Draw a bar graph: violent crime by city
A title such as "Which big U.S. cities have the most violent crime?". Bottom axis: City. Side axis: Violent crimes per 100,000 people, from 0 to 2,000, going up by 200 on each dark line.
| City | Violent crimes per 100,000 people |
|---|---|
| Memphis, TN | 1,850 |
| Stockton, CA | 1,030 |
| Cincinnati, OH | 790 |
| Seattle, WA | 710 |
| Long Beach, CA | 620 |
| Durham, NC | 510 |
| Austin, TX | 420 |
| Chula Vista, CA | 370 |
| Irving, TX | 270 |
| Irvine, CA | 80 |
10 of the 89 on the chart, from the highest to the lowest. Numbers are rounded to make them easier to plot. Source: FBI Crime Data Explorer, Uniform Crime Reporting Program (Public domain (U.S. government work); source FBI Uniform Crime Reporting Program) · Data as of Dec 31, 2025
The finished Chartly chart
Every number the source has, not only the table's rows.
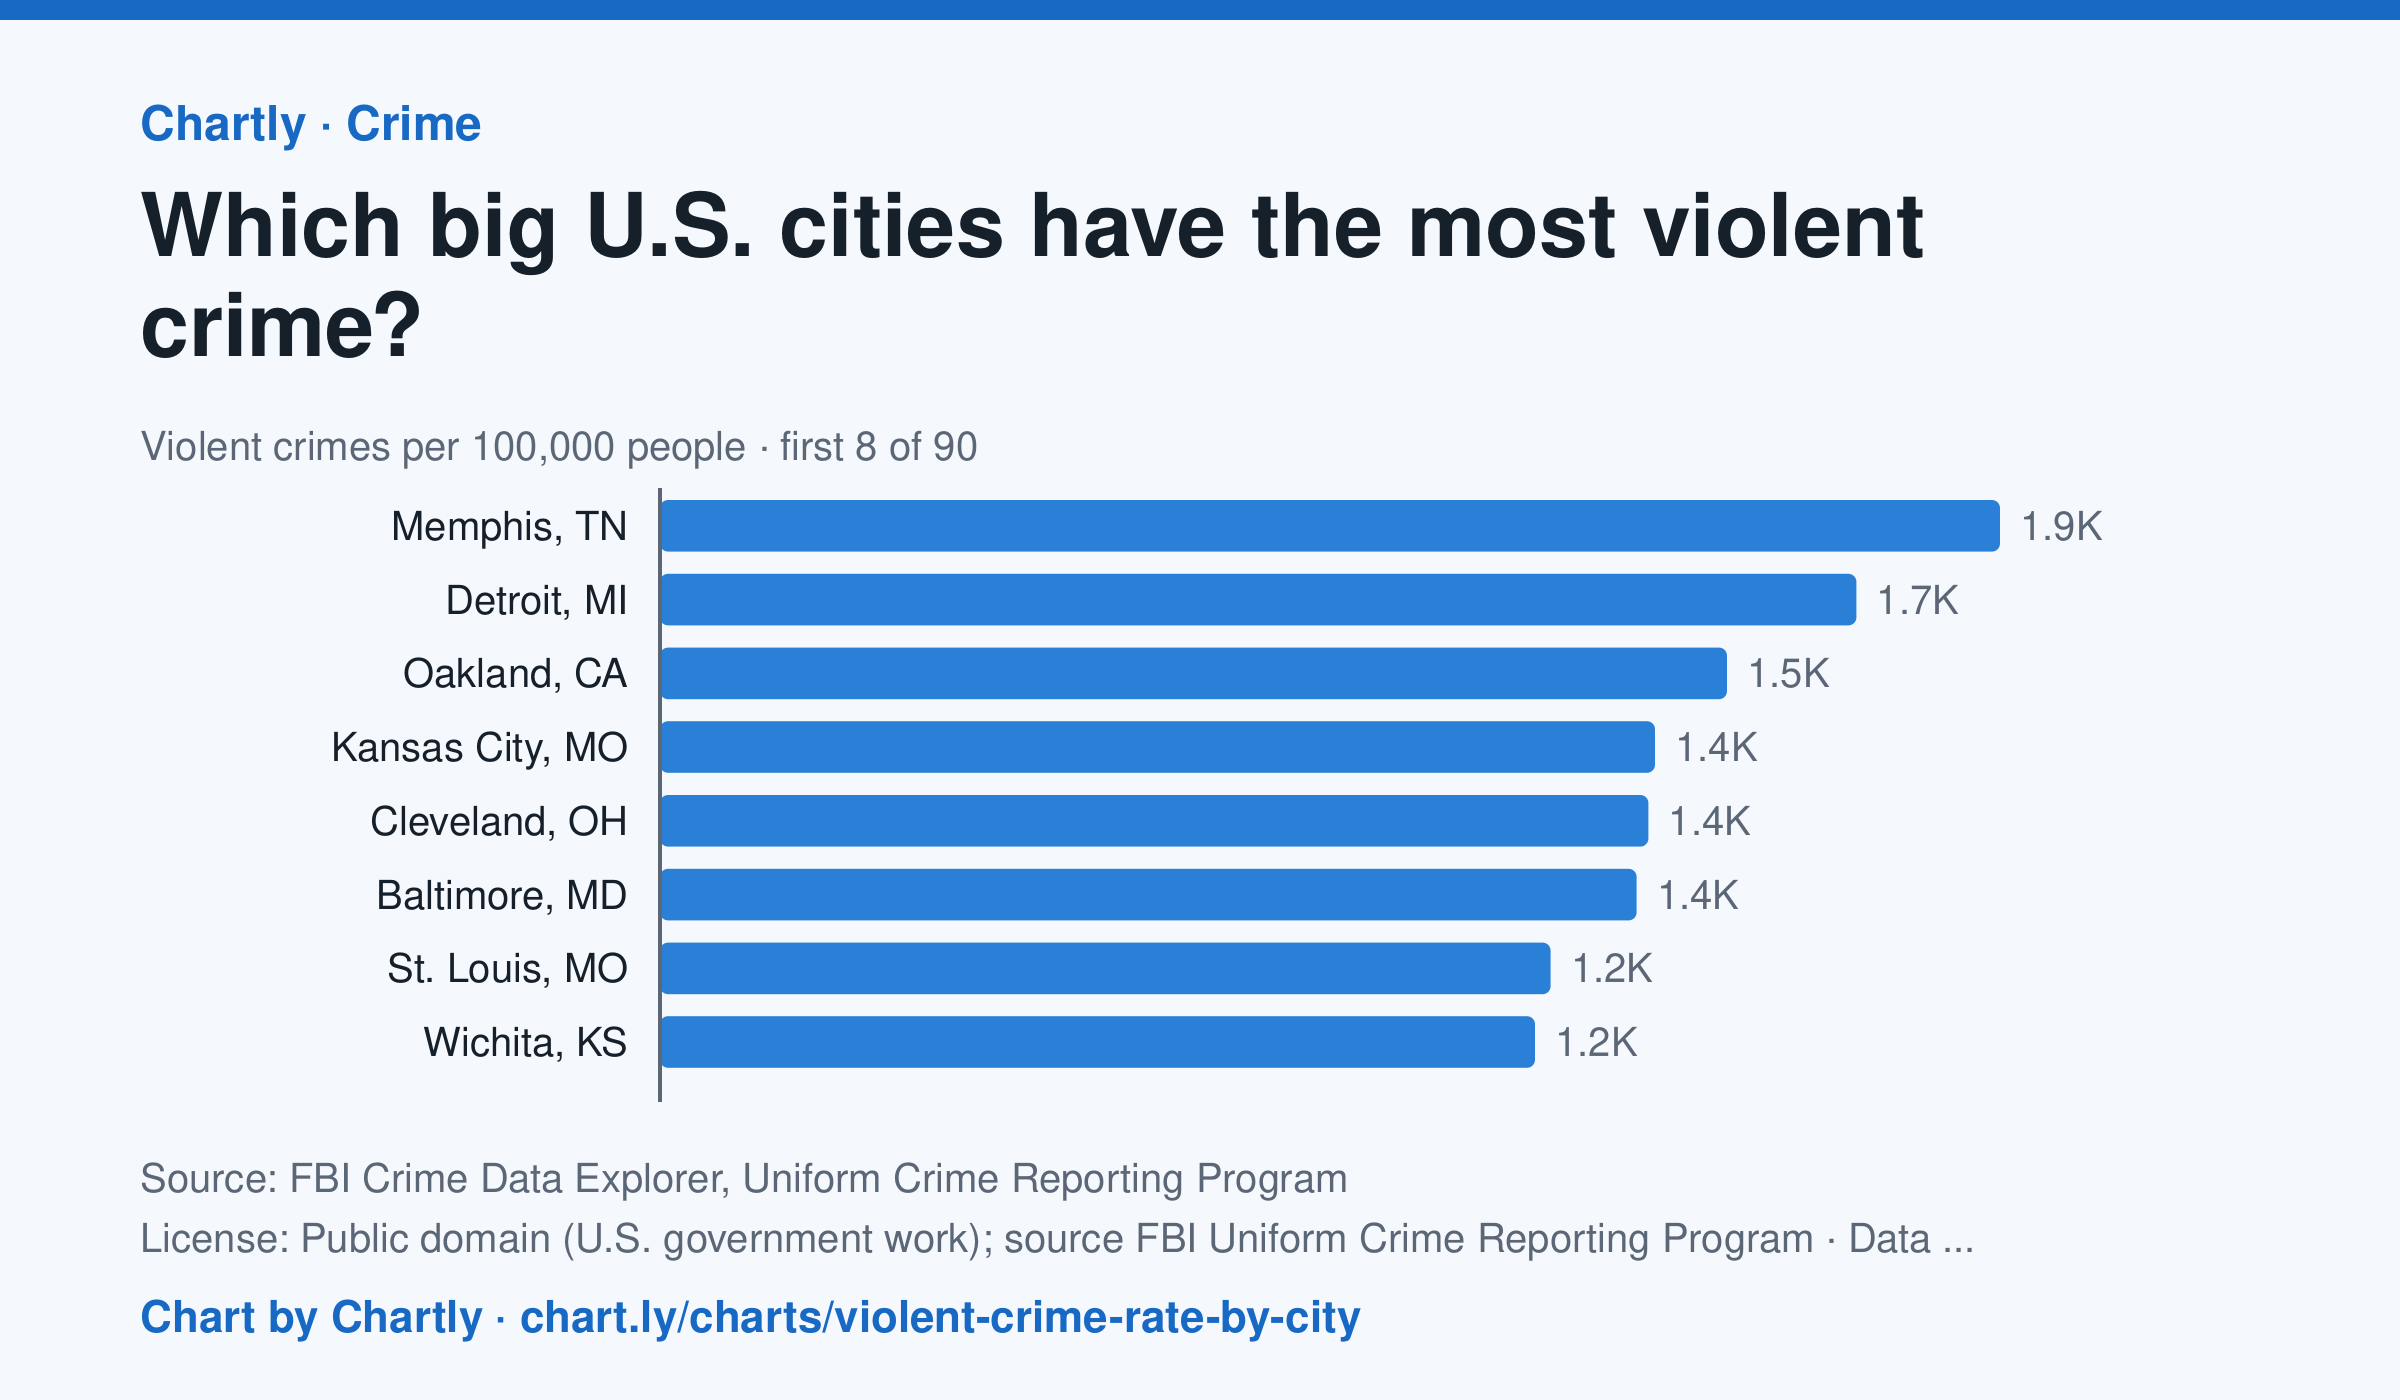
In 2025, Memphis, TN had the highest violent crime rate of the 89 biggest U.S. cities whose police reported a full year to the FBI, about 1,853 per 100,000 people, followed by Detroit, MI (1,654) and Oakland, CA (1,475). Irvine, CA (79) and Virginia Beach, VA (101) had the lowest; the U.S. rate was about 330. Violent crime is murder, rape, robbery and aggravated assault. In 2025 the police in New Orleans, Orlando and St. Petersburg, Florida, didn't report a full year of crimes, so they are left out. Each rate is per person the department serves, and a few, such as Las Vegas, Honolulu, Jacksonville and Louisville, serve their whole county. A city's rate also depends on where its borders fall, so compare cities with care.
Chart and numbers: chart.ly/charts/violent-crime-rate-by-city · Source: FBI Crime Data Explorer, Uniform Crime Reporting Program (Public domain (U.S. government work); source FBI Uniform Crime Reporting Program) · Data as of Dec 31, 2025