The teacher's answer key. Students' scales may differ; any even scale that starts at 0 and fits the biggest number is right.
Answer key · graphing practice
Draw a line graph: unemployment
A title such as "What is the US unemployment rate?". Bottom axis: Month. Side axis: Percent of the labor force unemployed, seasonally adjusted, from 0 to 10, going up by 1 on each dark line.
| Month | Percent of the labor force unemployed, seasonally adjusted |
|---|---|
| Oct 1951 | 3.5 |
| Oct 1966 | 3.7 |
| Oct 1981 | 7.9 |
| Oct 1996 | 5.2 |
| Oct 2011 | 8.8 |
| Oct 2026 | 4.1 |
Every few years from the chart, ending with the newest. Numbers are rounded to make them easier to plot. Source: U.S. Bureau of Labor Statistics, Current Population Survey (Public domain (U.S. government work)) · Data as of Oct 31, 2026
The finished Chartly chart
Every number the source has, not only the table's rows.
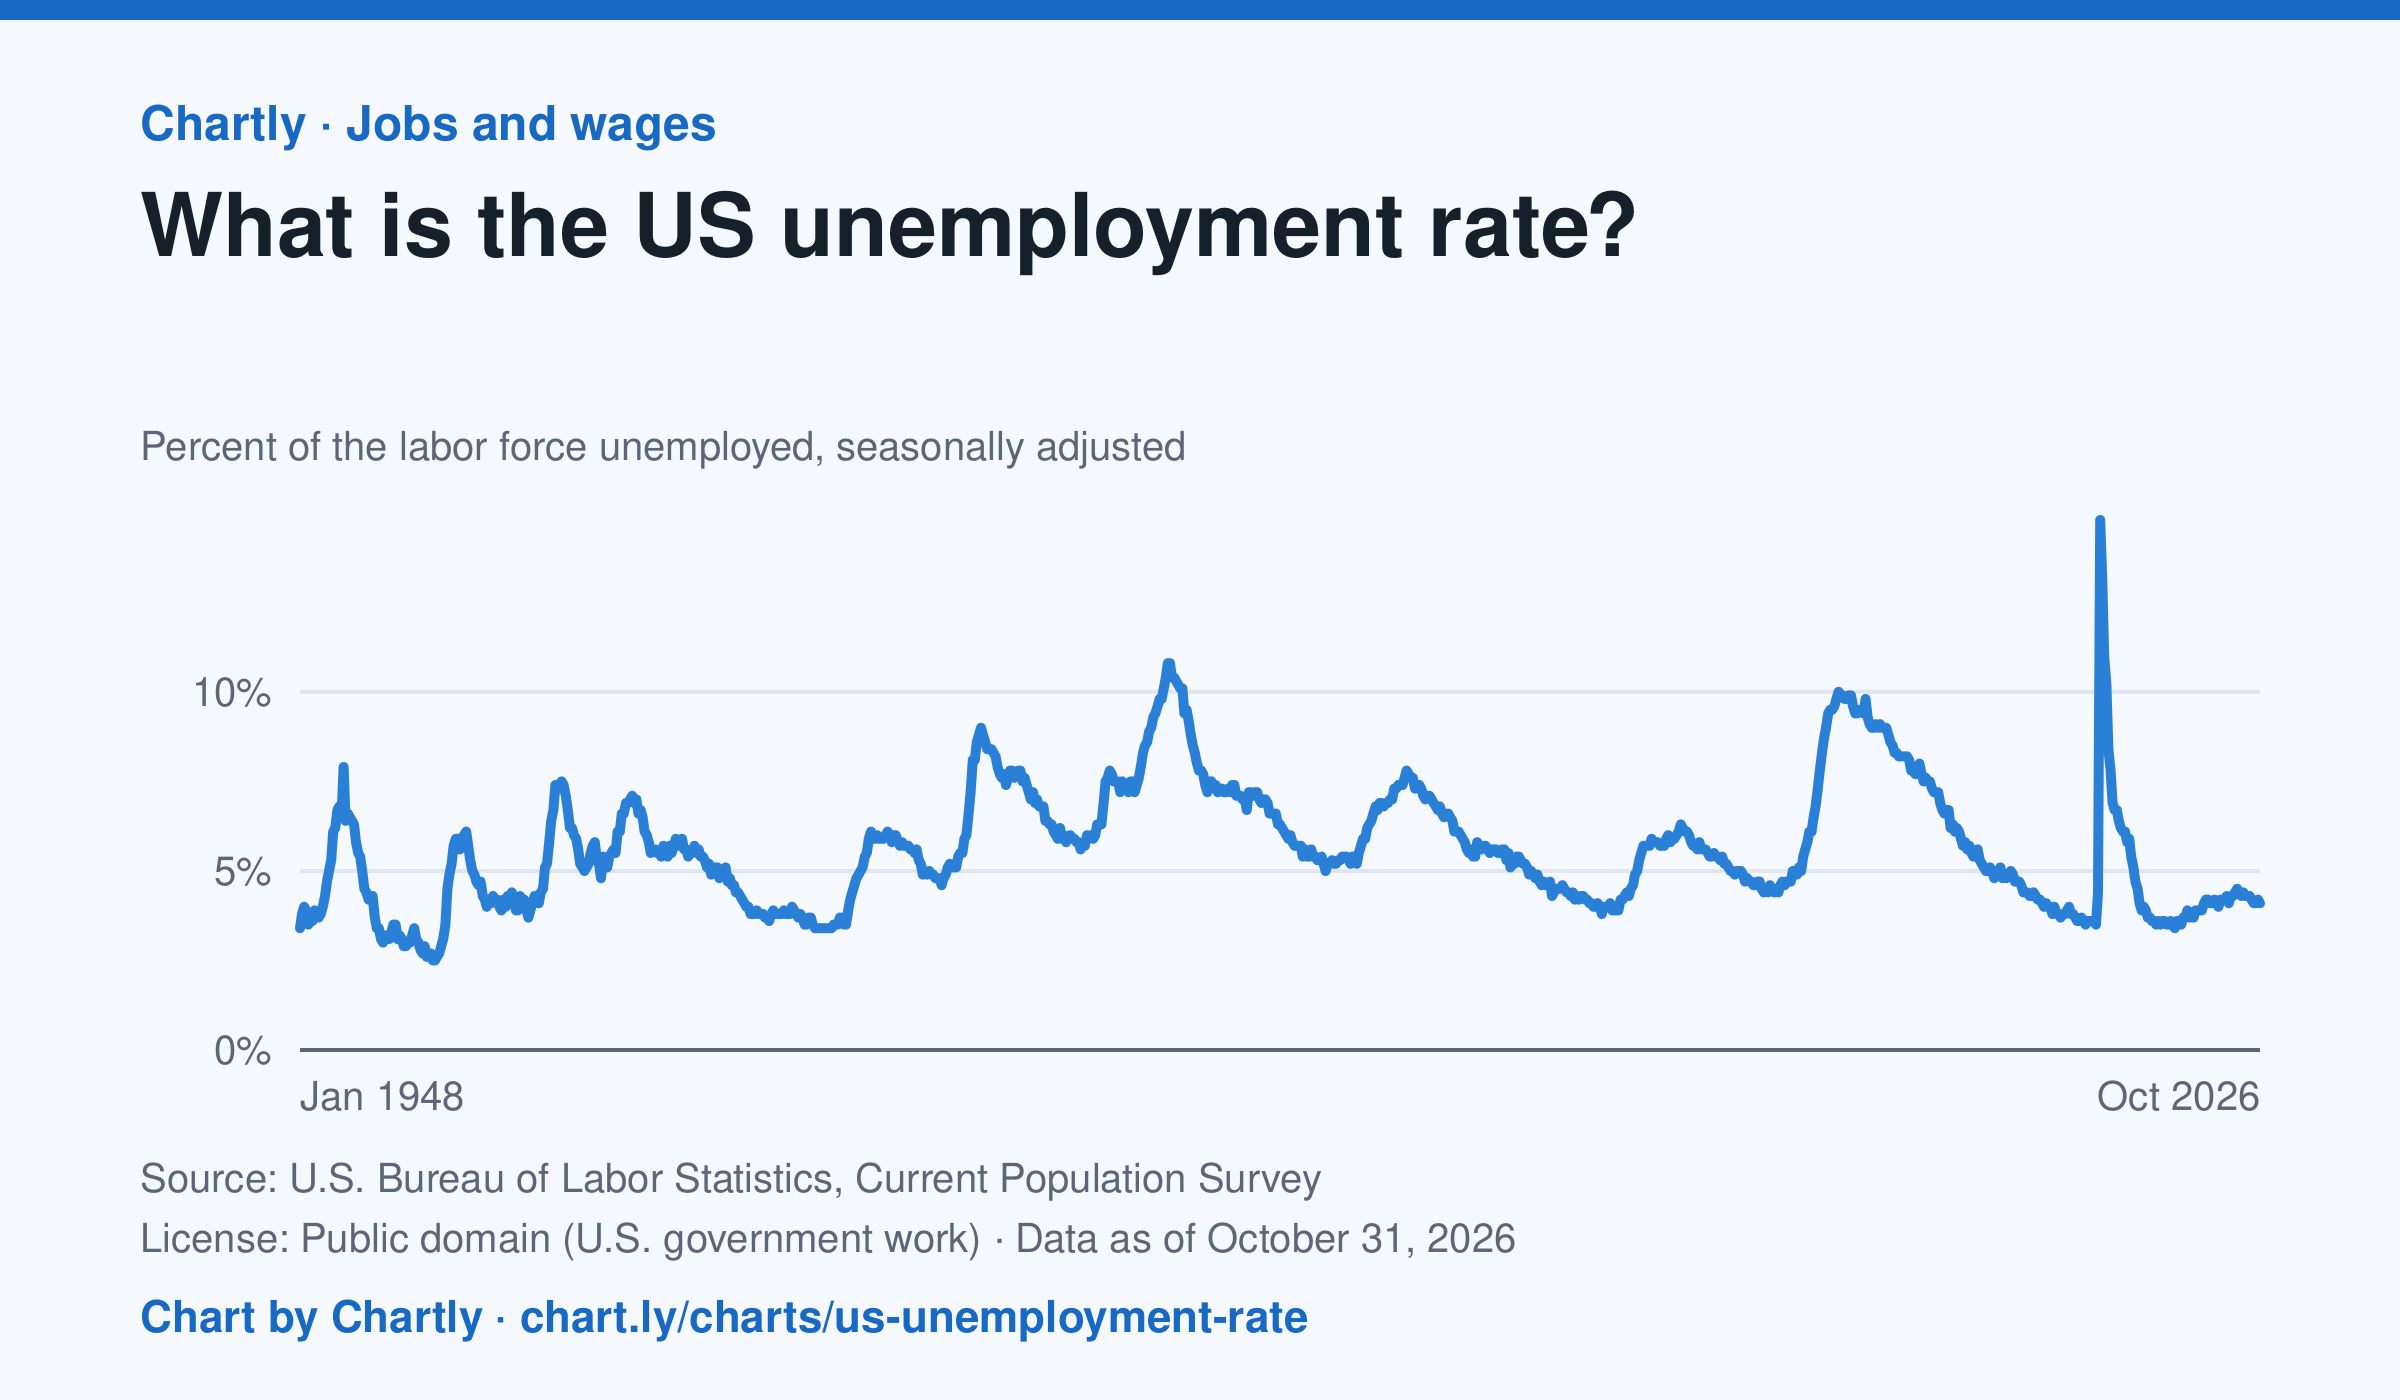
4.1% of the US labor force was unemployed in October 2026, against 4.4% in September 2025. Since the monthly rate began in 1948 it peaked at 14.8% in April 2020, at the start of the pandemic, and was lowest at 2.5% in May 1953. October 2025 is missing because a lapse in federal funding stopped the survey.
Chart and numbers: chart.ly/charts/us-unemployment-rate · Source: U.S. Bureau of Labor Statistics, Current Population Survey (Public domain (U.S. government work)) · Data as of Oct 31, 2026