The teacher's answer key. Students' scales may differ; any even scale that starts at 0 and fits the biggest number is right.
Answer key · graphing practice
Draw a line graph: traffic deaths
A title such as "Are U.S. roads getting safer per mile driven?". Bottom axis: Year. Side axis: Deaths per 100 million vehicle miles, from 0 to 5, going up by 0.5 on each dark line.
| Year | Deaths per 100 million vehicle miles |
|---|---|
| 1984 | 2.57 |
| 1994 | 1.73 |
| 2004 | 1.44 |
| 2014 | 1.08 |
| 2024 | 1.19 |
Every few years from the chart, ending with the newest. Numbers are rounded to make them easier to plot. Source: NHTSA Fatality Analysis Reporting System (FARS) and FHWA Highway Statistics (table VM-2) (Public domain (U.S. government work)) · Data as of Dec 31, 2024
The finished Chartly chart
Every number the source has, not only the table's rows.
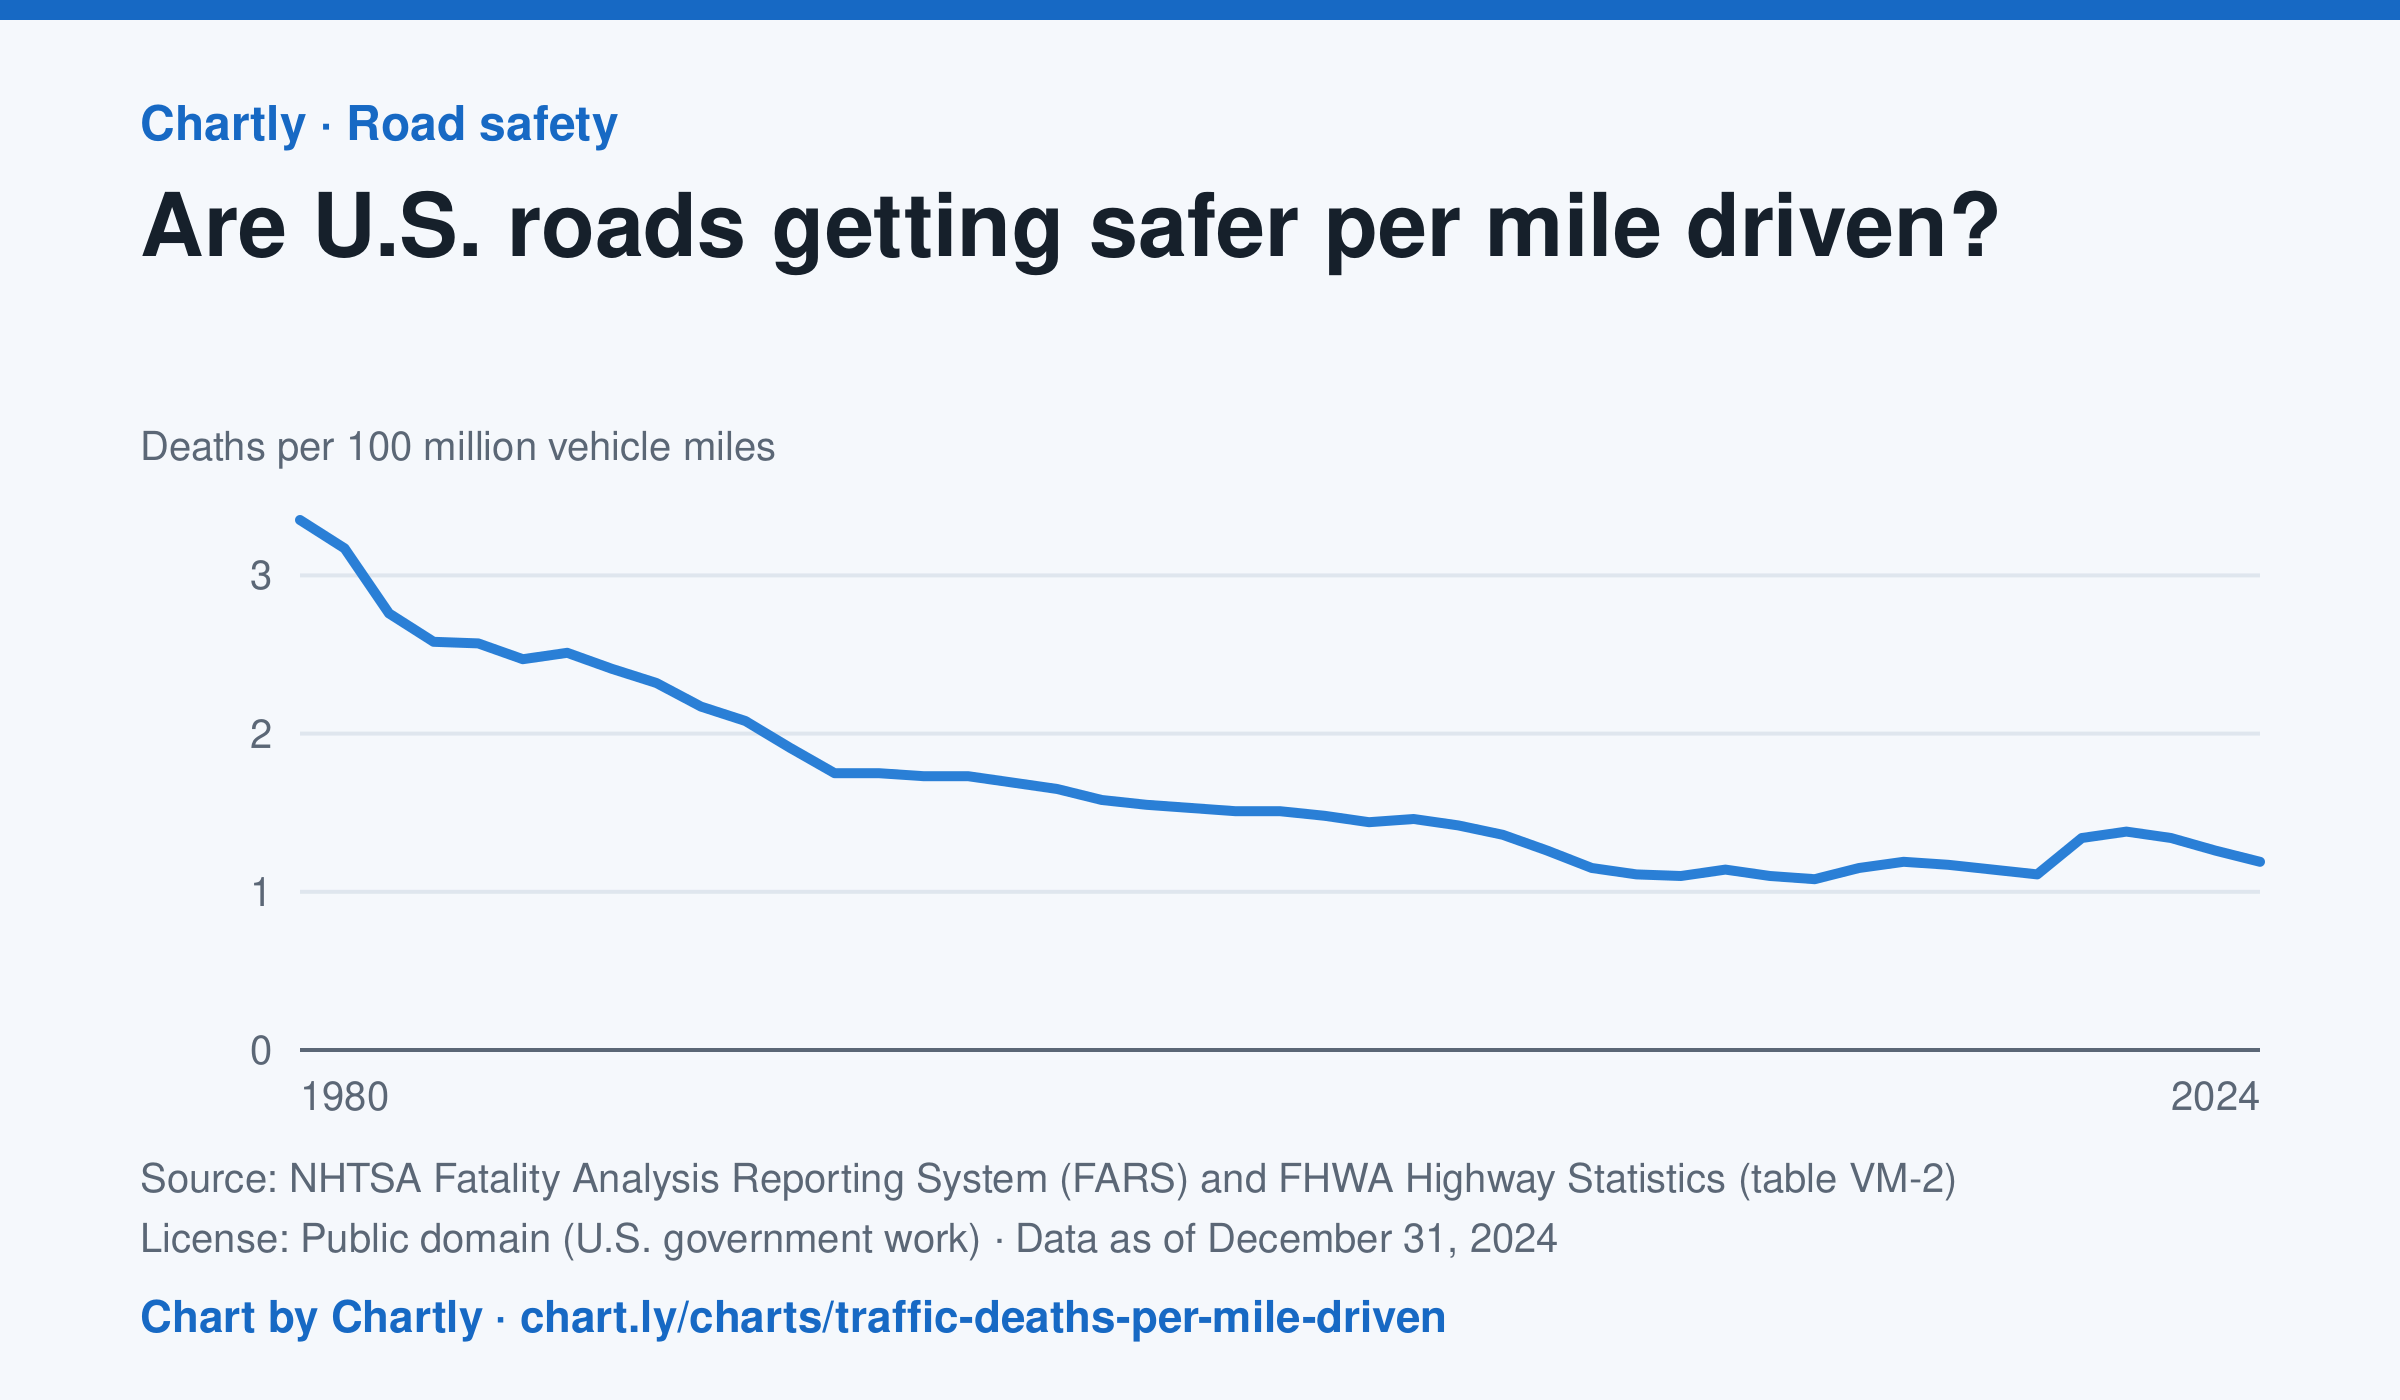
In 2024 there were 1.19 deaths for every 100 million miles driven, down from 3.35 in 1980. The lowest rate was 1.08 in 2014; it jumped to 1.34 in 2020, when people drove less but deaths rose. Miles driven are the Federal Highway Administration's estimates.
Chart and numbers: chart.ly/charts/traffic-deaths-per-mile-driven · Source: NHTSA Fatality Analysis Reporting System (FARS) and FHWA Highway Statistics (table VM-2) (Public domain (U.S. government work)) · Data as of Dec 31, 2024