The teacher's answer key. Students' scales may differ; any even scale that starts at 0 and fits the biggest number is right.
Answer key · graphing practice
Draw a bar graph: school spending
A title such as "How much does each state spend per public school student?". Bottom axis: State. Side axis: Spending per student, dollars a year, from 0 to 50,000, going up by 5,000 on each dark line.
| State | Spending per student, dollars a year |
|---|---|
| New York | 31,900 |
| Hawaii | 23,900 |
| Pennsylvania | 21,100 |
| Washington | 18,600 |
| Virginia | 17,100 |
| Georgia | 15,800 |
| Nevada | 14,800 |
| Alabama | 13,600 |
| South Dakota | 12,800 |
| Idaho | 11,100 |
10 of the 51 on the chart, from the highest to the lowest. Numbers are rounded to make them easier to plot. Source: U.S. Census Bureau, Annual Survey of School System Finances (Public domain (U.S. government work)) · Data as of Jun 30, 2024
The finished Chartly chart
Every number the source has, not only the table's rows.
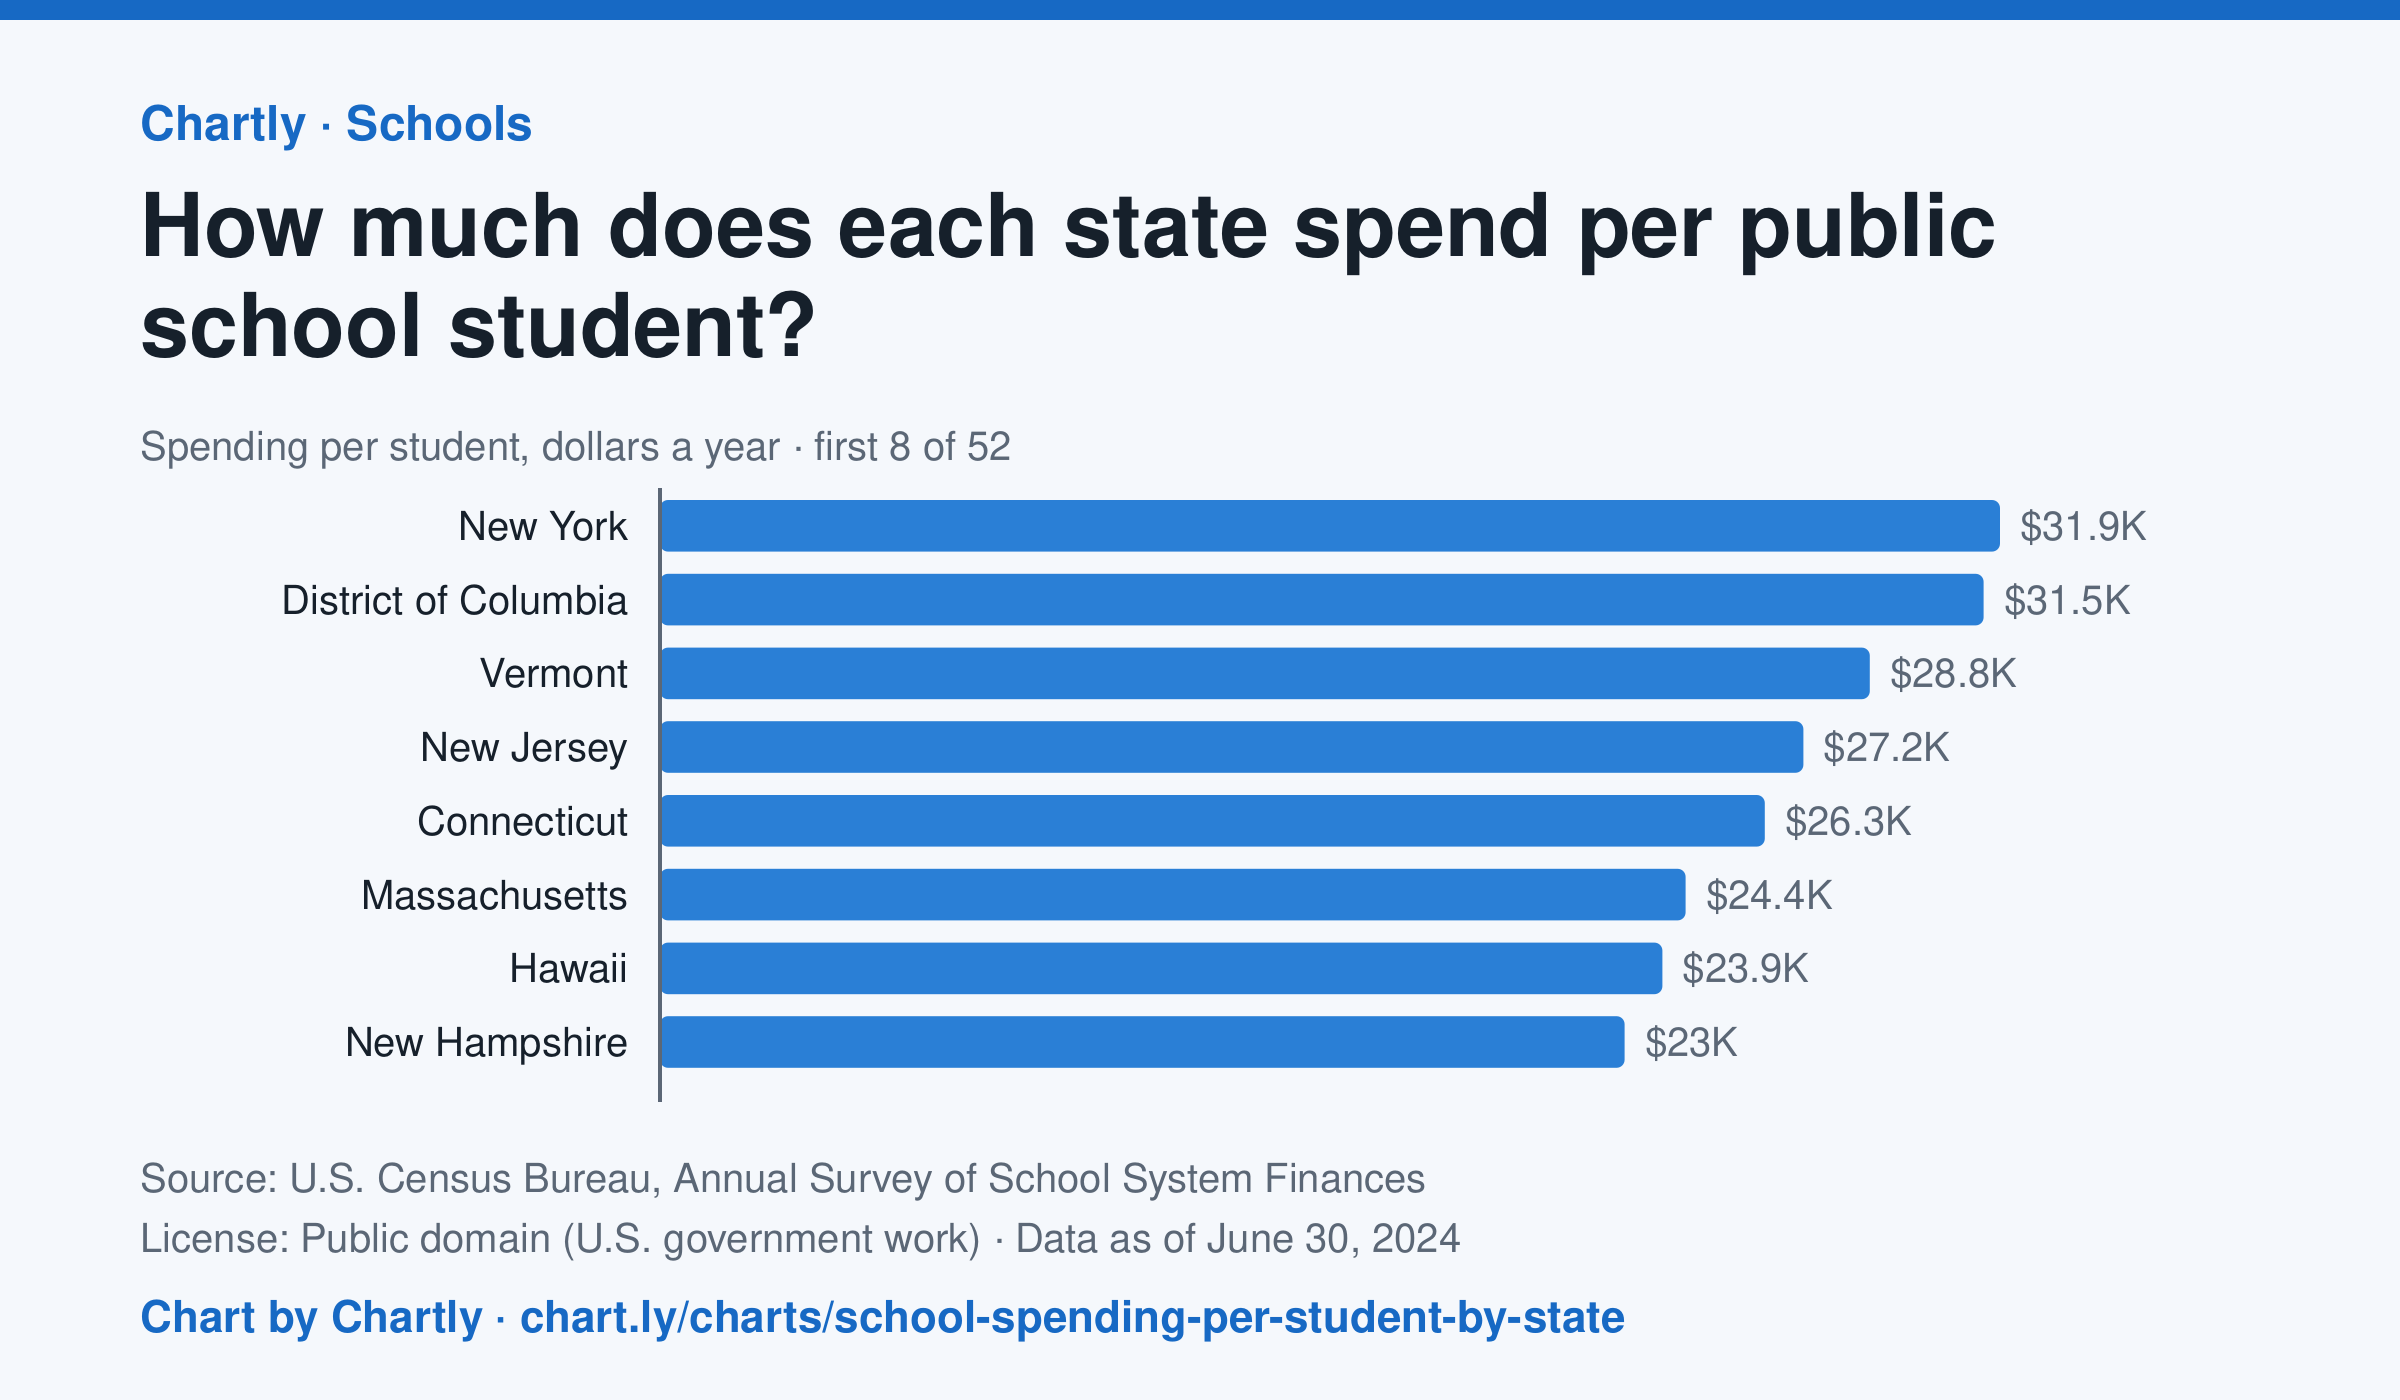
In the school year that ended in 2024, New York spent the most per public school student, $31,918, followed by District of Columbia ($31,529) and Vermont ($28,818). Idaho spent the least, $11,060, and the figure for the whole U.S. was $17,619. This is day-to-day spending on teachers, staff, supplies and buses, not on buildings or debt, and it isn't adjusted for each state's prices.
Chart and numbers: chart.ly/charts/school-spending-per-student-by-state · Source: U.S. Census Bureau, Annual Survey of School System Finances (Public domain (U.S. government work)) · Data as of Jun 30, 2024