The teacher's answer key. Students' scales may differ; any even scale that starts at 0 and fits the biggest number is right.
Answer key · graphing practice
Draw a bar graph: NFL field goals
A title such as "How often are NFL field goals good from each distance?". Bottom axis: Distance of the kick. Side axis: Field goal tries made (%), from 0 to 100, going up by 10 on each dark line.
| Distance of the kick | Field goal tries made (%) |
|---|---|
| Under 30 yards | 98.1 |
| 30–39 yards | 93 |
| 40–49 yards | 84.3 |
| 50 yards or longer | 68.8 |
Every bar on the chart. Numbers are rounded to make them easier to plot. Source: nflverse, NFL team season stats (nflverse-data) (CC BY 4.0 (nflverse)) · Data as of Jan 4, 2026
The finished Chartly chart
Every number the source has, not only the table's rows.
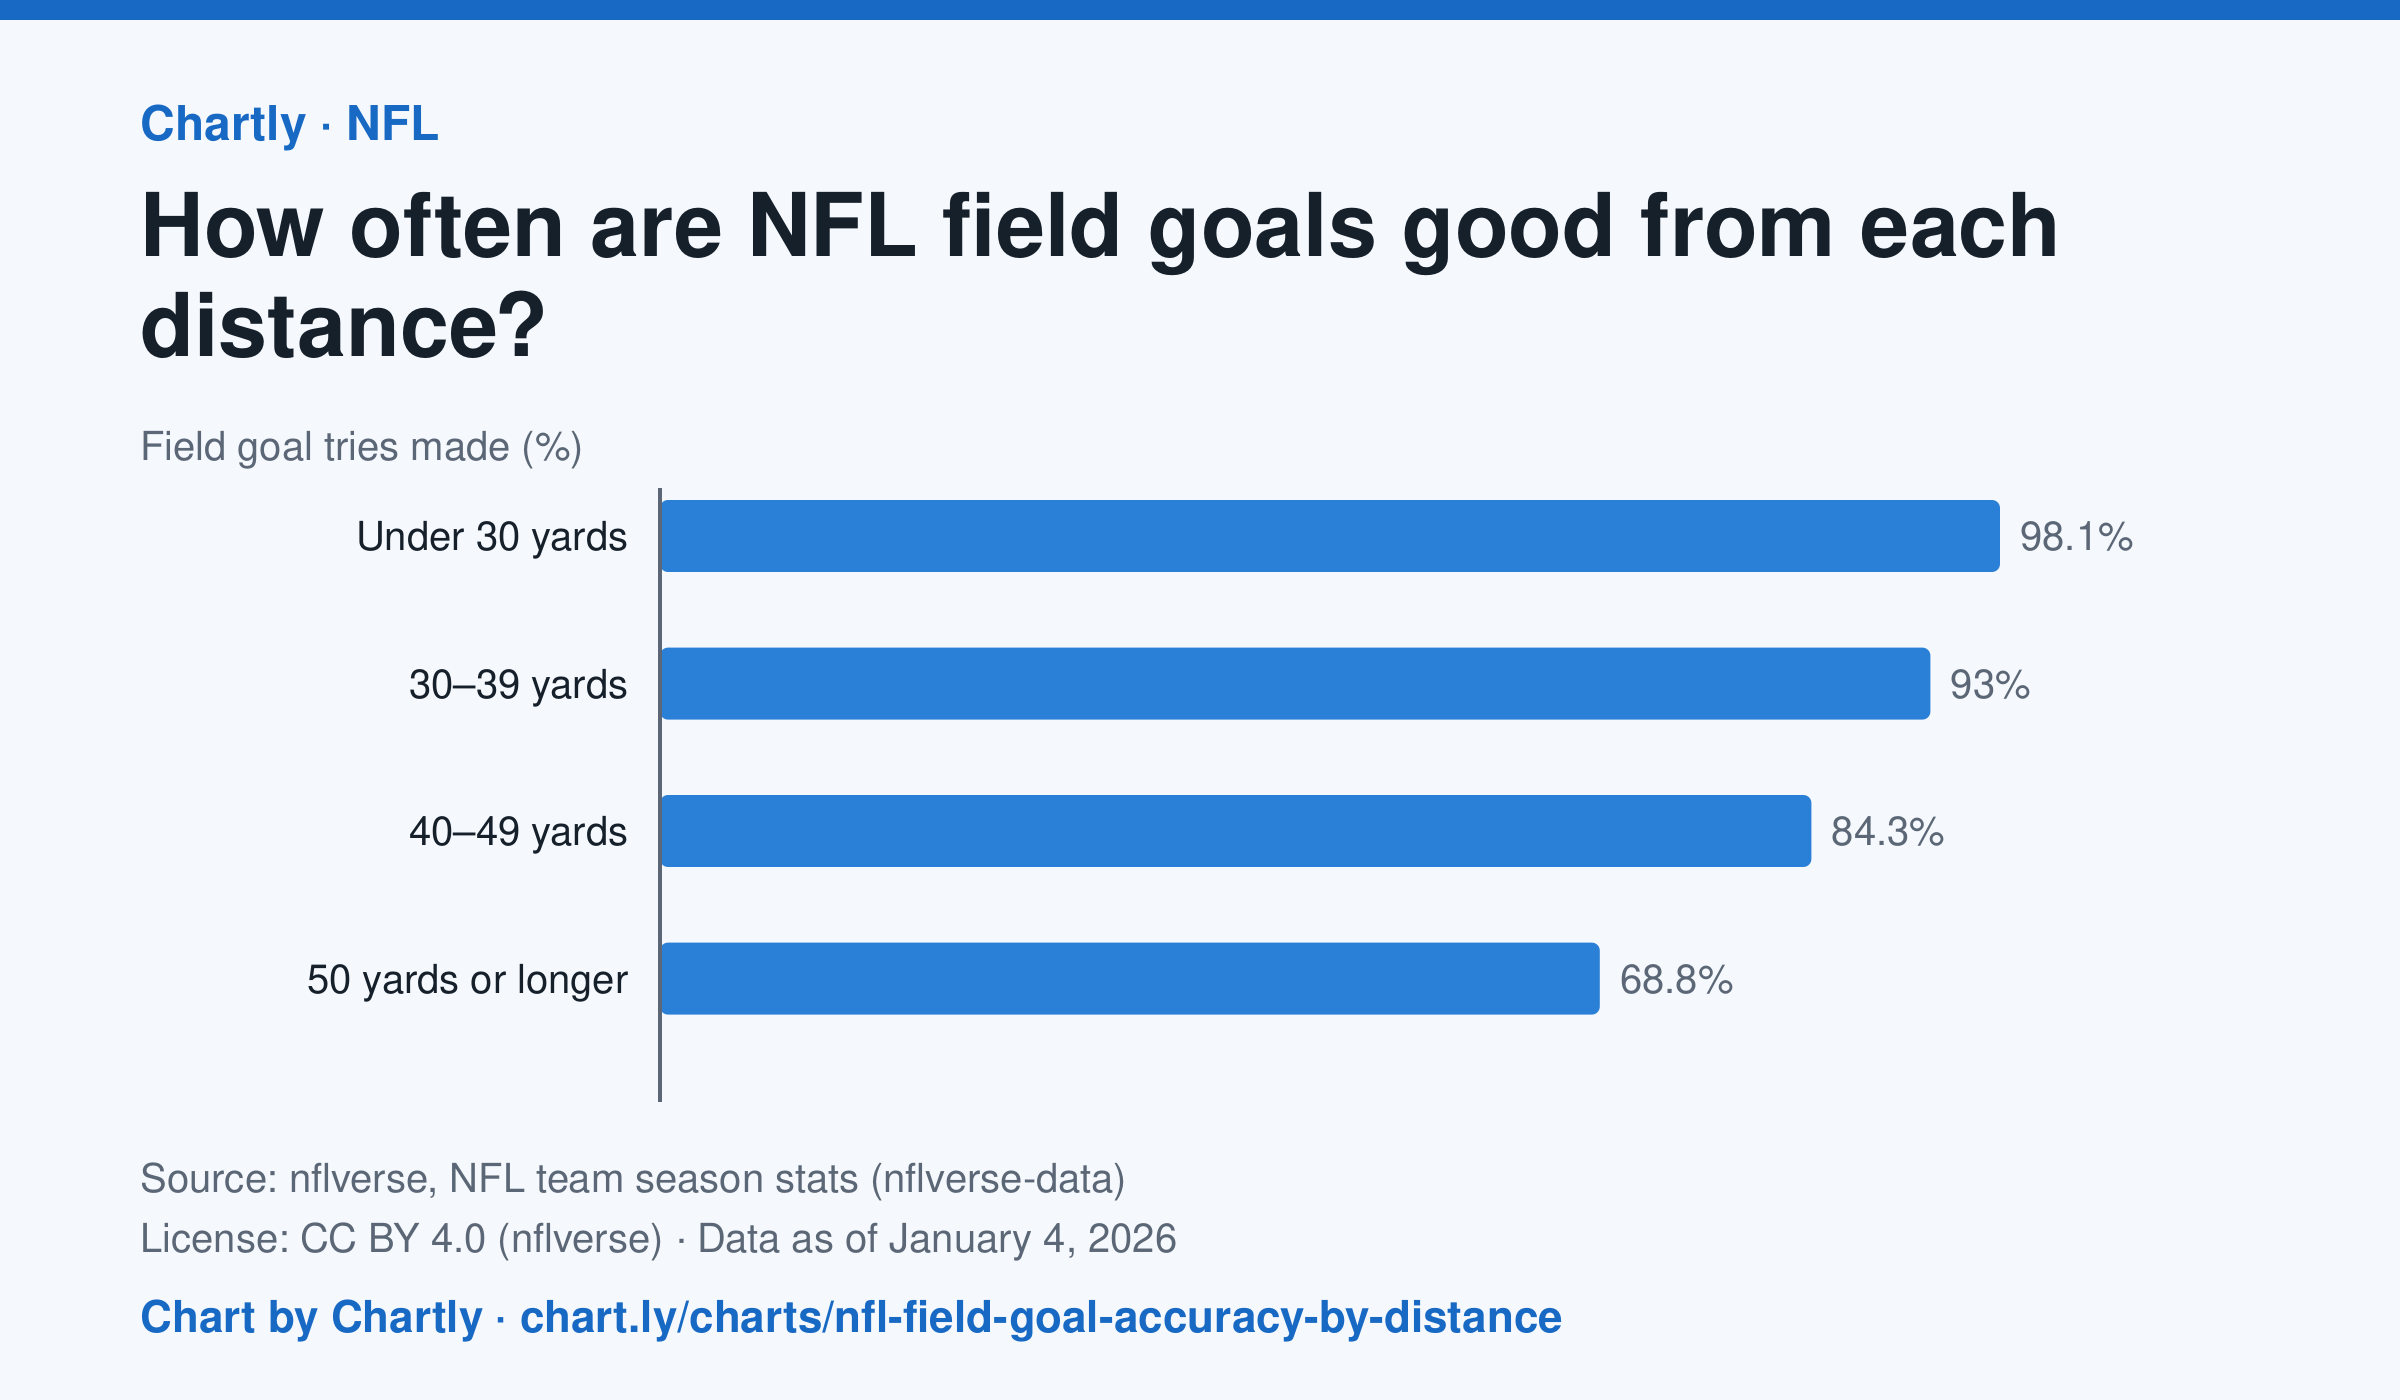
In the NFL regular season that ended in January 2026, kickers made 98.1% of field goal tries from under 30 yards, 84.3% from 40 to 49 yards and 68.8% from 50 yards or longer. Blocked kicks count as misses.
Chart and numbers: chart.ly/charts/nfl-field-goal-accuracy-by-distance · Source: nflverse, NFL team season stats (nflverse-data) (CC BY 4.0 (nflverse)) · Data as of Jan 4, 2026