The teacher's answer key. Students' scales may differ; any even scale that starts at 0 and fits the biggest number is right.
Answer key · graphing practice
Draw a line graph: national debt
A title such as "How big is the federal debt compared with the economy?". Bottom axis: Fiscal year. Side axis: Debt as % of GDP, from 0 to 200, going up by 20 on each dark line.
| Fiscal year | Debt as % of GDP |
|---|---|
| 1951 | 78 |
| 1966 | 41 |
| 1981 | 32 |
| 1996 | 66 |
| 2011 | 96 |
| 2026 | 125 |
Every few years from the chart, ending with the newest. Numbers are rounded to make them easier to plot. Source: U.S. Treasury Fiscal Data, Historical Debt Outstanding; GDP from the Bureau of Economic Analysis (NIPA Table 1.1.5) (Public domain (U.S. government work)) · Data as of Sep 30, 2026
The finished Chartly chart
Every number the source has, not only the table's rows.
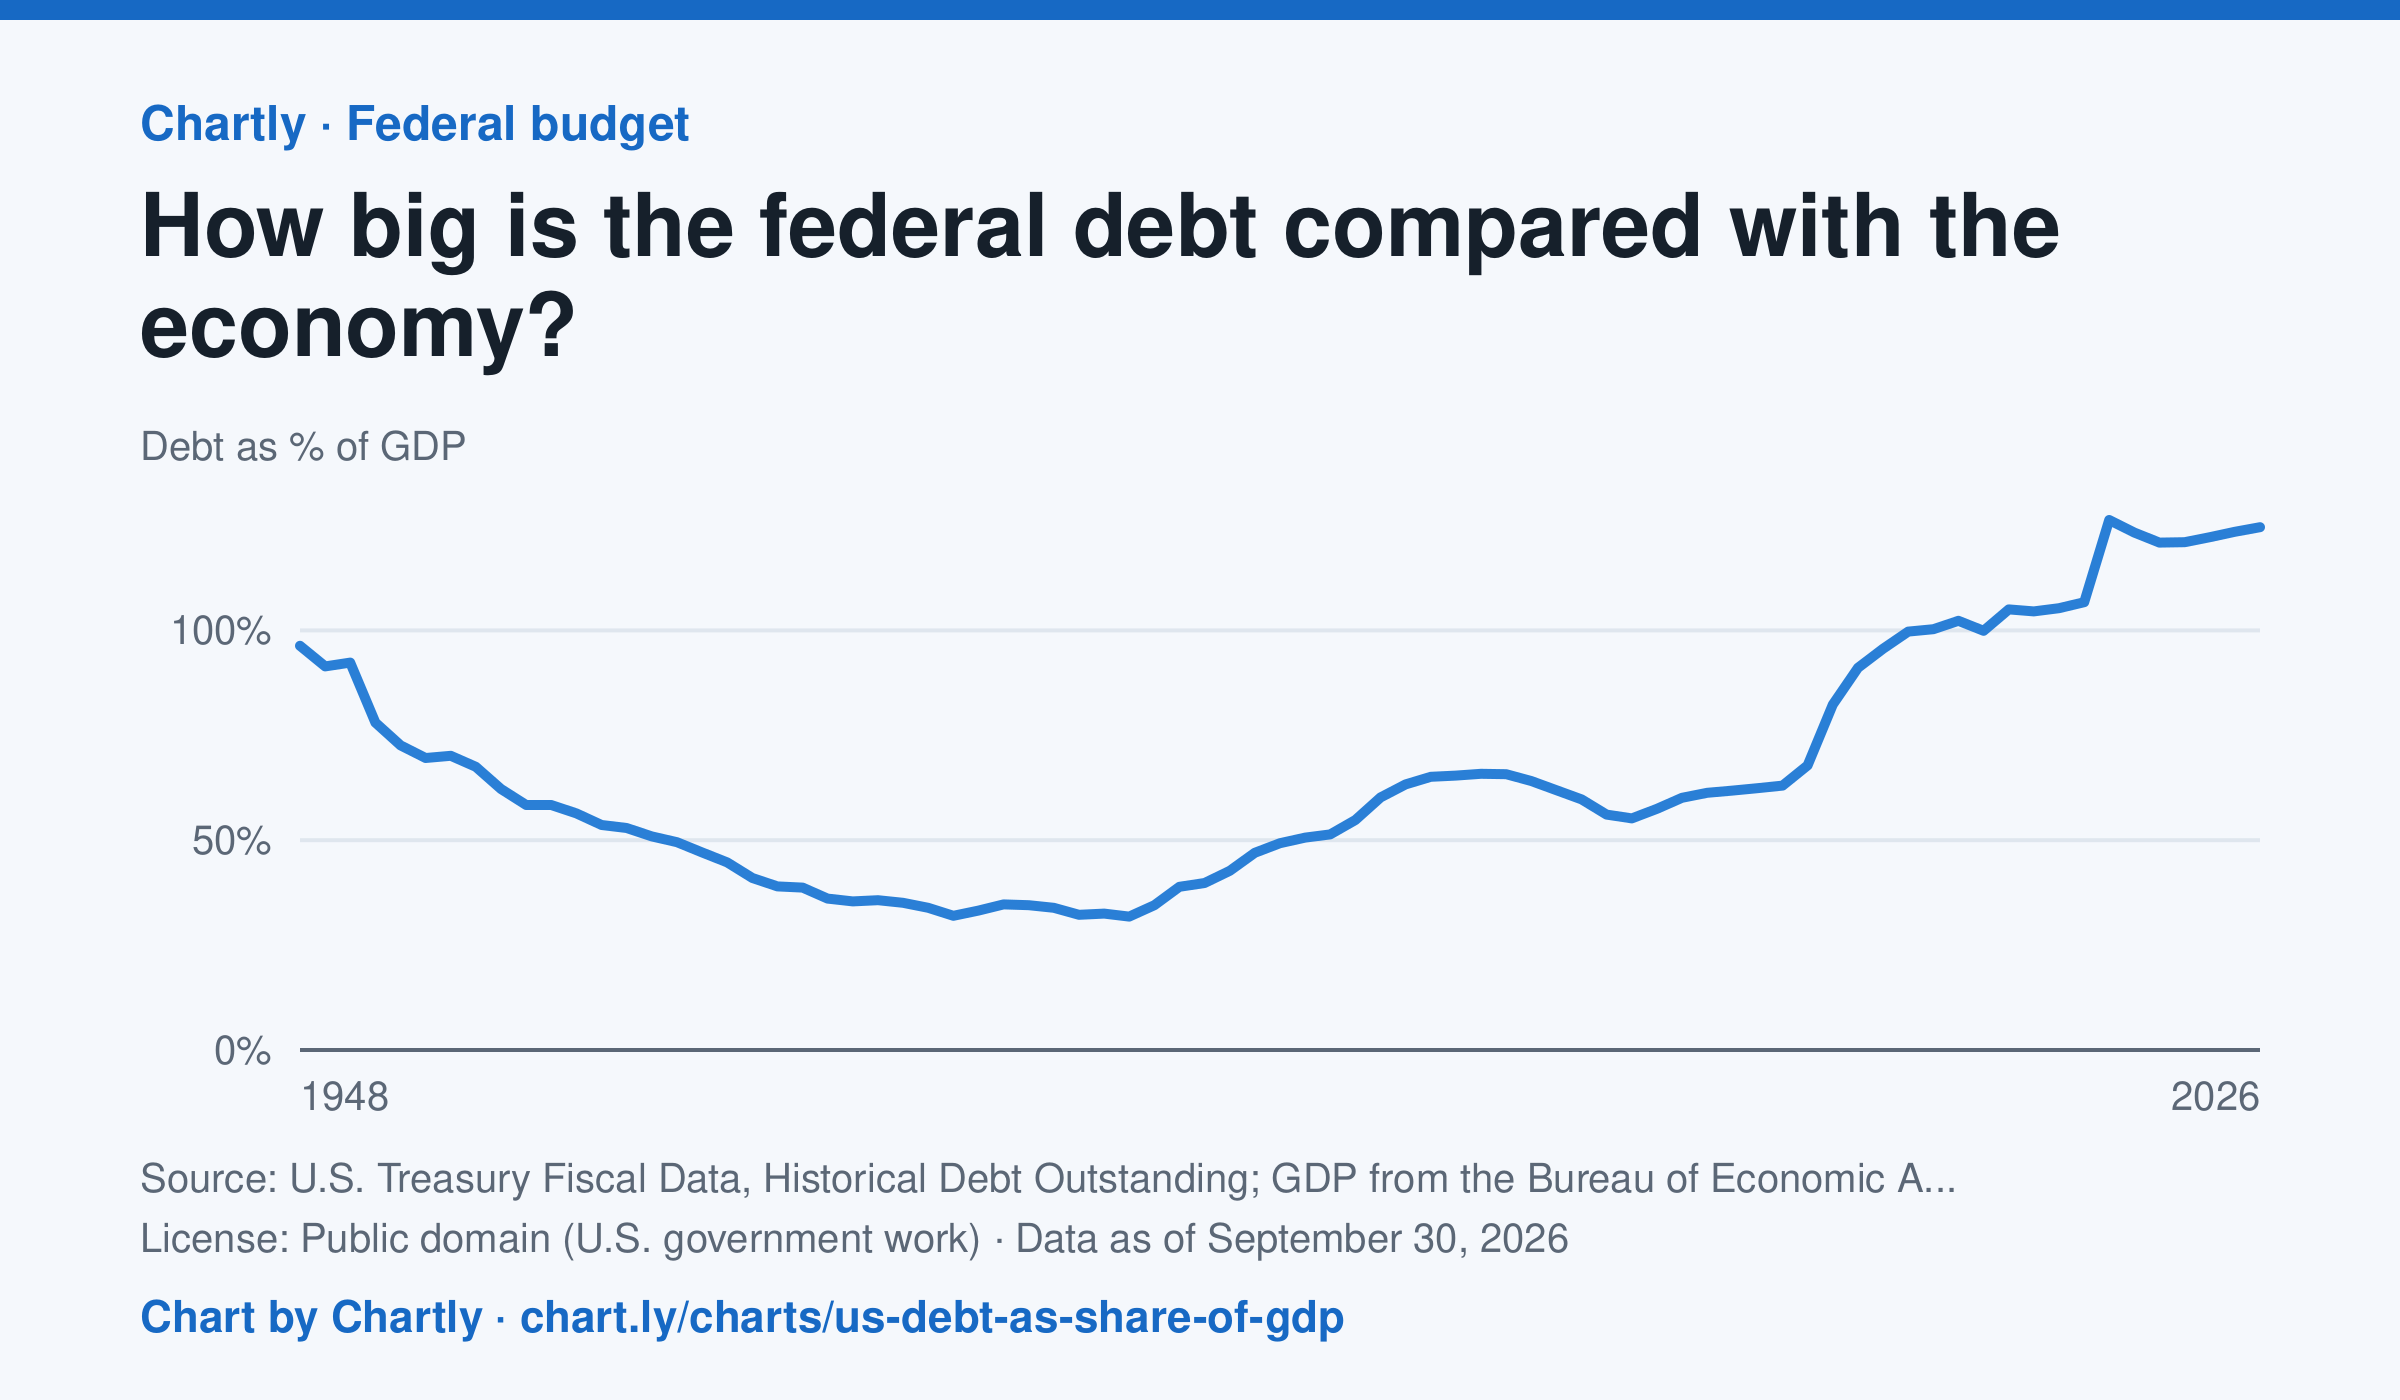
At the end of fiscal 2026 the federal debt was 125% of a year's GDP, everything the U.S. economy produces in a year. It fell from 96% in 1948 to a low of 32% in 1981, passed 100% in 2013 and jumped to 126% in 2020. This is total debt, including what the government owes its own trust funds, divided by GDP over the same fiscal year; it starts in 1948 because BEA's quarterly GDP starts in 1947, and recent GDP figures are revised.
Chart and numbers: chart.ly/charts/us-debt-as-share-of-gdp · Source: U.S. Treasury Fiscal Data, Historical Debt Outstanding; GDP from the Bureau of Economic Analysis (NIPA Table 1.1.5) (Public domain (U.S. government work)) · Data as of Sep 30, 2026