The teacher's answer key. Students' scales may differ; any even scale that starts at 0 and fits the biggest number is right.
Answer key · graphing practice
Draw a line graph: life expectancy
A title such as "How long do Americans live, and how has that changed since 1900?". Bottom axis: Year. Side axis: Life expectancy at birth, years, from 0 to 100, going up by 10 on each dark line.
| Year | Life expectancy at birth, years |
|---|---|
| 1918 | 39.1 |
| 1938 | 63.5 |
| 1958 | 69.6 |
| 1978 | 73.5 |
| 1998 | 76.7 |
| 2018 | 78.7 |
Every few years from the chart, ending with the newest. Numbers are rounded to make them easier to plot. Source: CDC National Center for Health Statistics, Death rates and life expectancy at birth (Public domain (U.S. government work)) · Data as of Dec 31, 2018
The finished Chartly chart
Every number the source has, not only the table's rows.
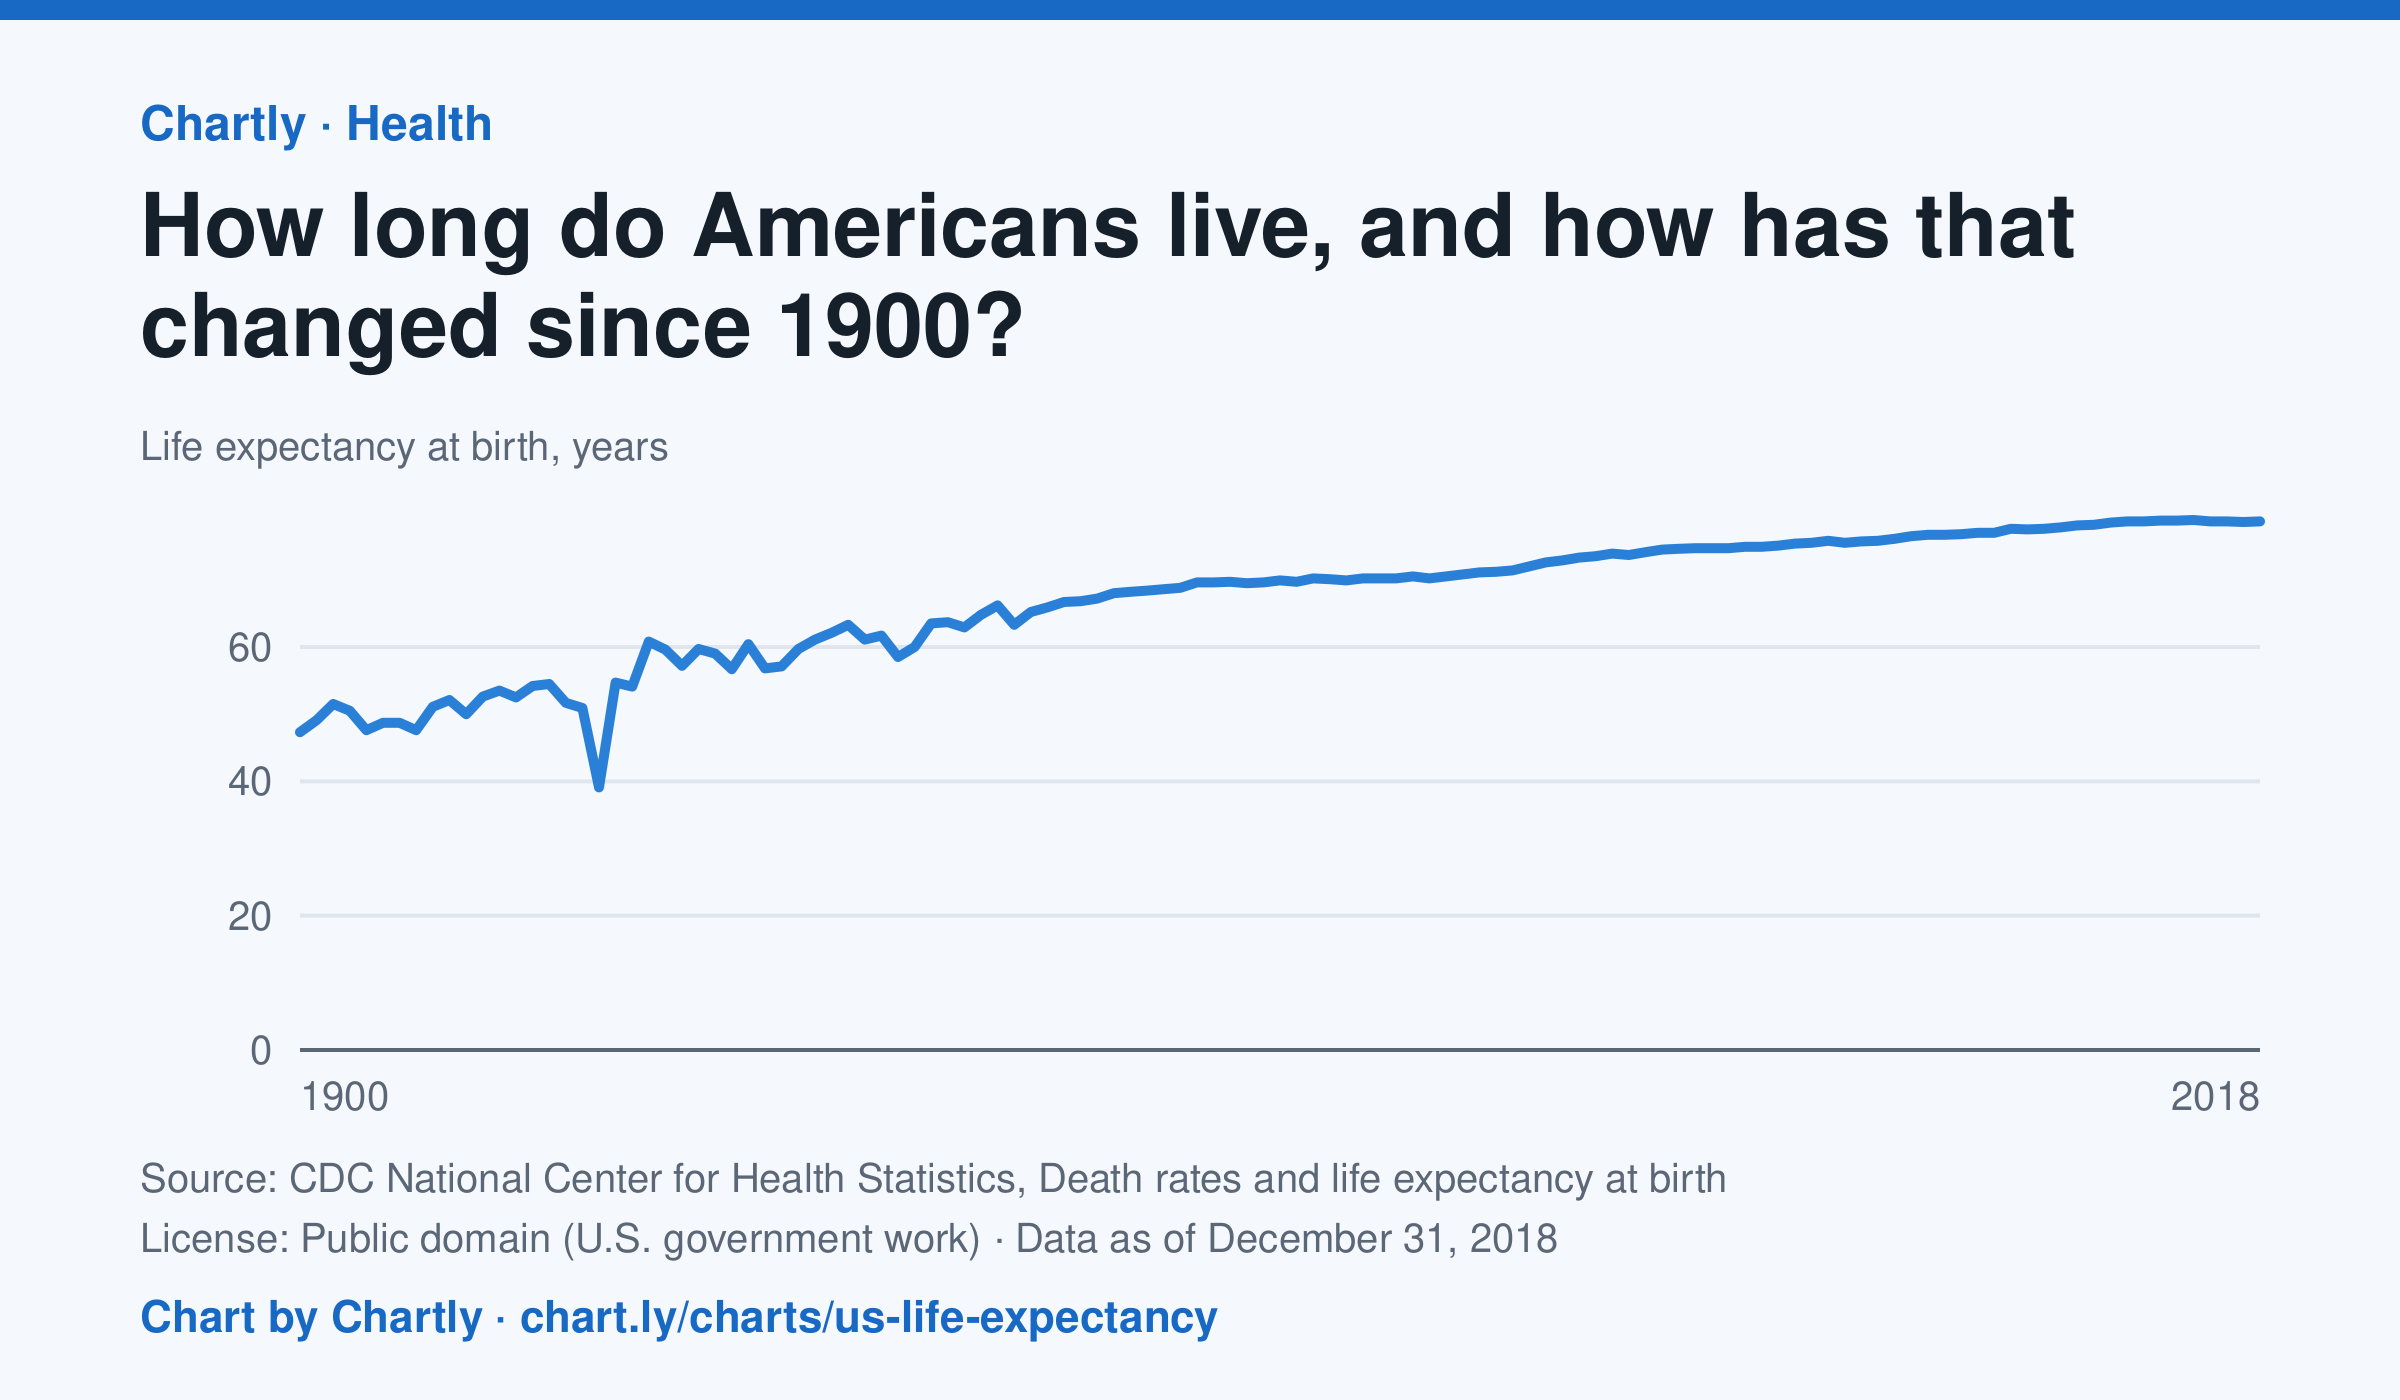
A baby born in the US in 2018 could expect to live 78.7 years, up from 47.3 in 1900. The sharpest drop was in 1918, to 39.1 years, during the influenza pandemic. This CDC dataset stops at 2018; later NCHS reports put life expectancy at 78.4 years in 2023 and 79.0 in 2024, after a fall during the COVID-19 pandemic.
Chart and numbers: chart.ly/charts/us-life-expectancy · Source: CDC National Center for Health Statistics, Death rates and life expectancy at birth (Public domain (U.S. government work)) · Data as of Dec 31, 2018