The teacher's answer key. Students' scales may differ; any even scale that starts at 0 and fits the biggest number is right.
Answer key · graphing practice
Draw a bar graph: internet use by country
A title such as "What share of people use the internet in each country?". Bottom axis: Country. Side axis: People using the internet, % of population, from 0 to 100, going up by 10 on each dark line.
| Country | People using the internet, % of population |
|---|---|
| Bahrain | 100 |
| Hong Kong | 96 |
| Kazakhstan | 93 |
| Kiribati | 89 |
| Brazil | 85 |
| South Africa | 78 |
| Cambodia | 69 |
| Sri Lanka | 55 |
| Liberia | 32 |
| Burundi | 9 |
10 of the 182 on the chart, from the highest to the lowest. Numbers are rounded to make them easier to plot. Source: World Bank, World Development Indicators: Individuals using the Internet (% of population) (CC BY 4.0 (credit the World Bank)) · Data as of Dec 31, 2024
The finished Chartly chart
Every number the source has, not only the table's rows.
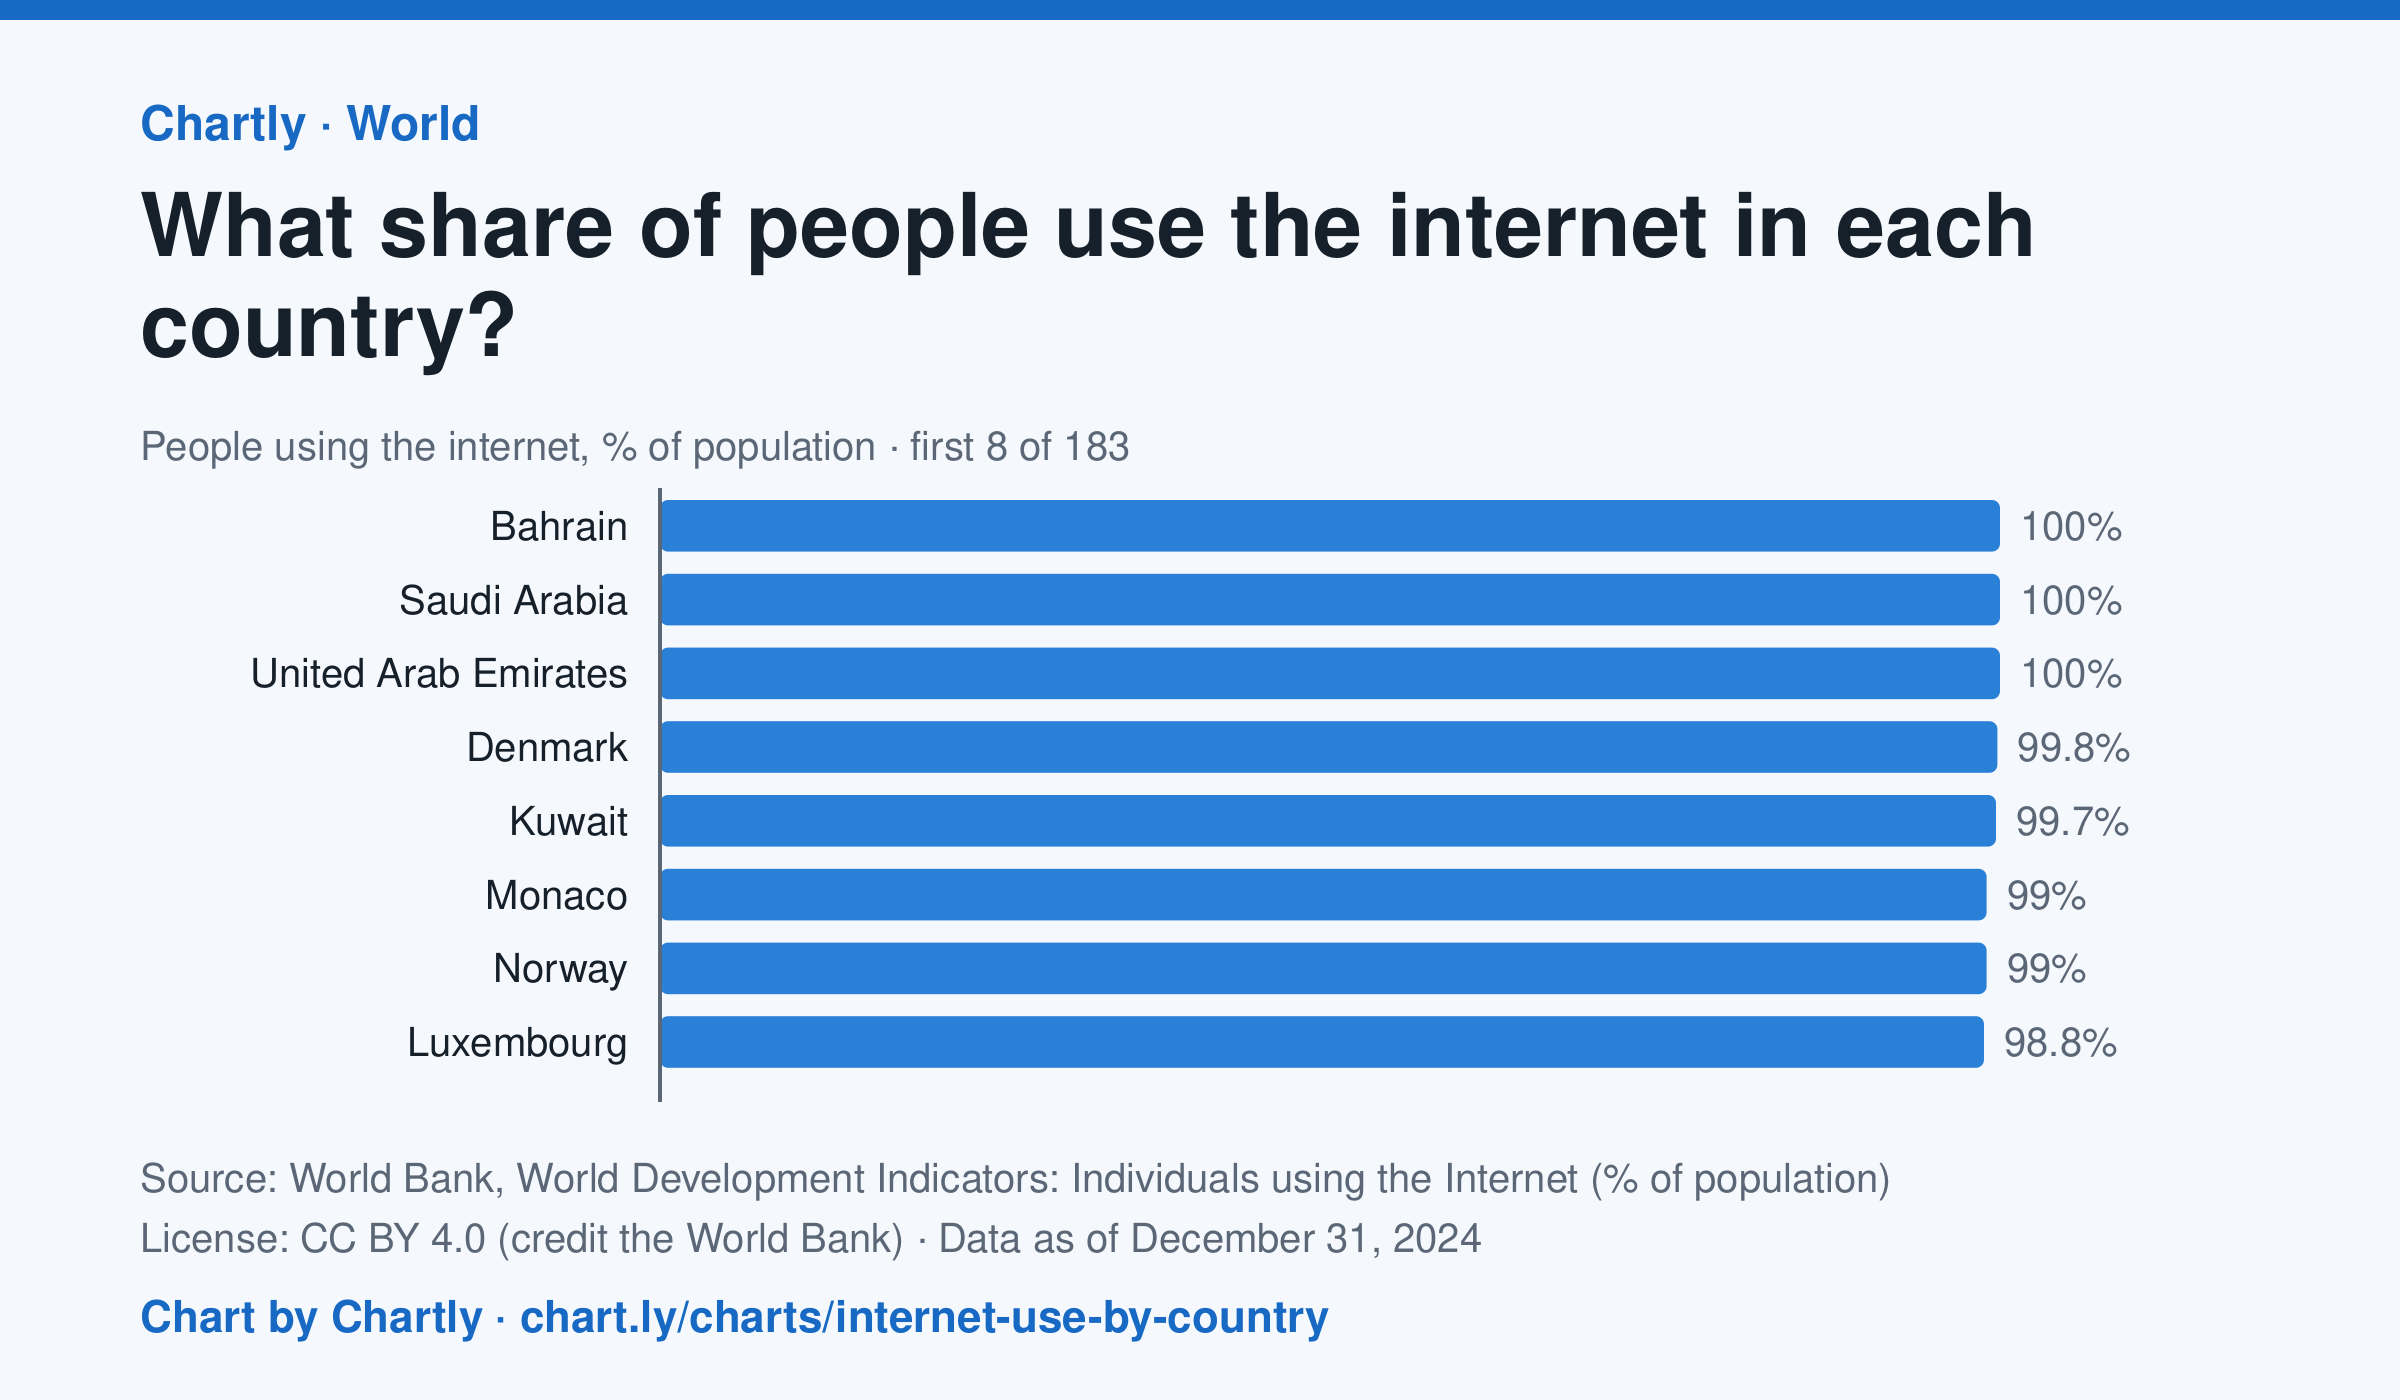
In 2024, 94.7% of people in the United States used the internet and 64.9% in India. The highest share was 100%, and the lowest 8.6%, in Burundi. 182 countries and territories had a 2024 figure. It counts people who used the internet at least once in the previous three months; places without a 2024 figure are left out.
Chart and numbers: chart.ly/charts/internet-use-by-country · Source: World Bank, World Development Indicators: Individuals using the Internet (% of population) (CC BY 4.0 (credit the World Bank)) · Data as of Dec 31, 2024