The teacher's answer key. Students' scales may differ; any even scale that starts at 0 and fits the biggest number is right.
Answer key · graphing practice
Draw a bar graph: household income by state
A title such as "What is the typical household income in each state?". Bottom axis: State. Side axis: Median household income, dollars a year, from 0 to 200,000, going up by 20,000 on each dark line.
| State | Median household income, dollars a year |
|---|---|
| District of Columbia | 110,000 |
| New Hampshire | 99,000 |
| Virginia | 93,000 |
| Illinois | 83,000 |
| Nevada | 78,000 |
| Nebraska | 76,000 |
| Florida | 75,000 |
| Ohio | 71,000 |
| New Mexico | 64,000 |
| Mississippi | 56,000 |
10 of the 51 on the chart, from the highest to the lowest. Numbers are rounded to make them easier to plot. Source: U.S. Census Bureau, American Community Survey 5-year estimates (Public domain (U.S. government work). This product uses the Census Bureau Data API but is not endorsed or certified by the Census Bureau.) · Data as of Dec 31, 2024
The finished Chartly chart
Every number the source has, not only the table's rows.
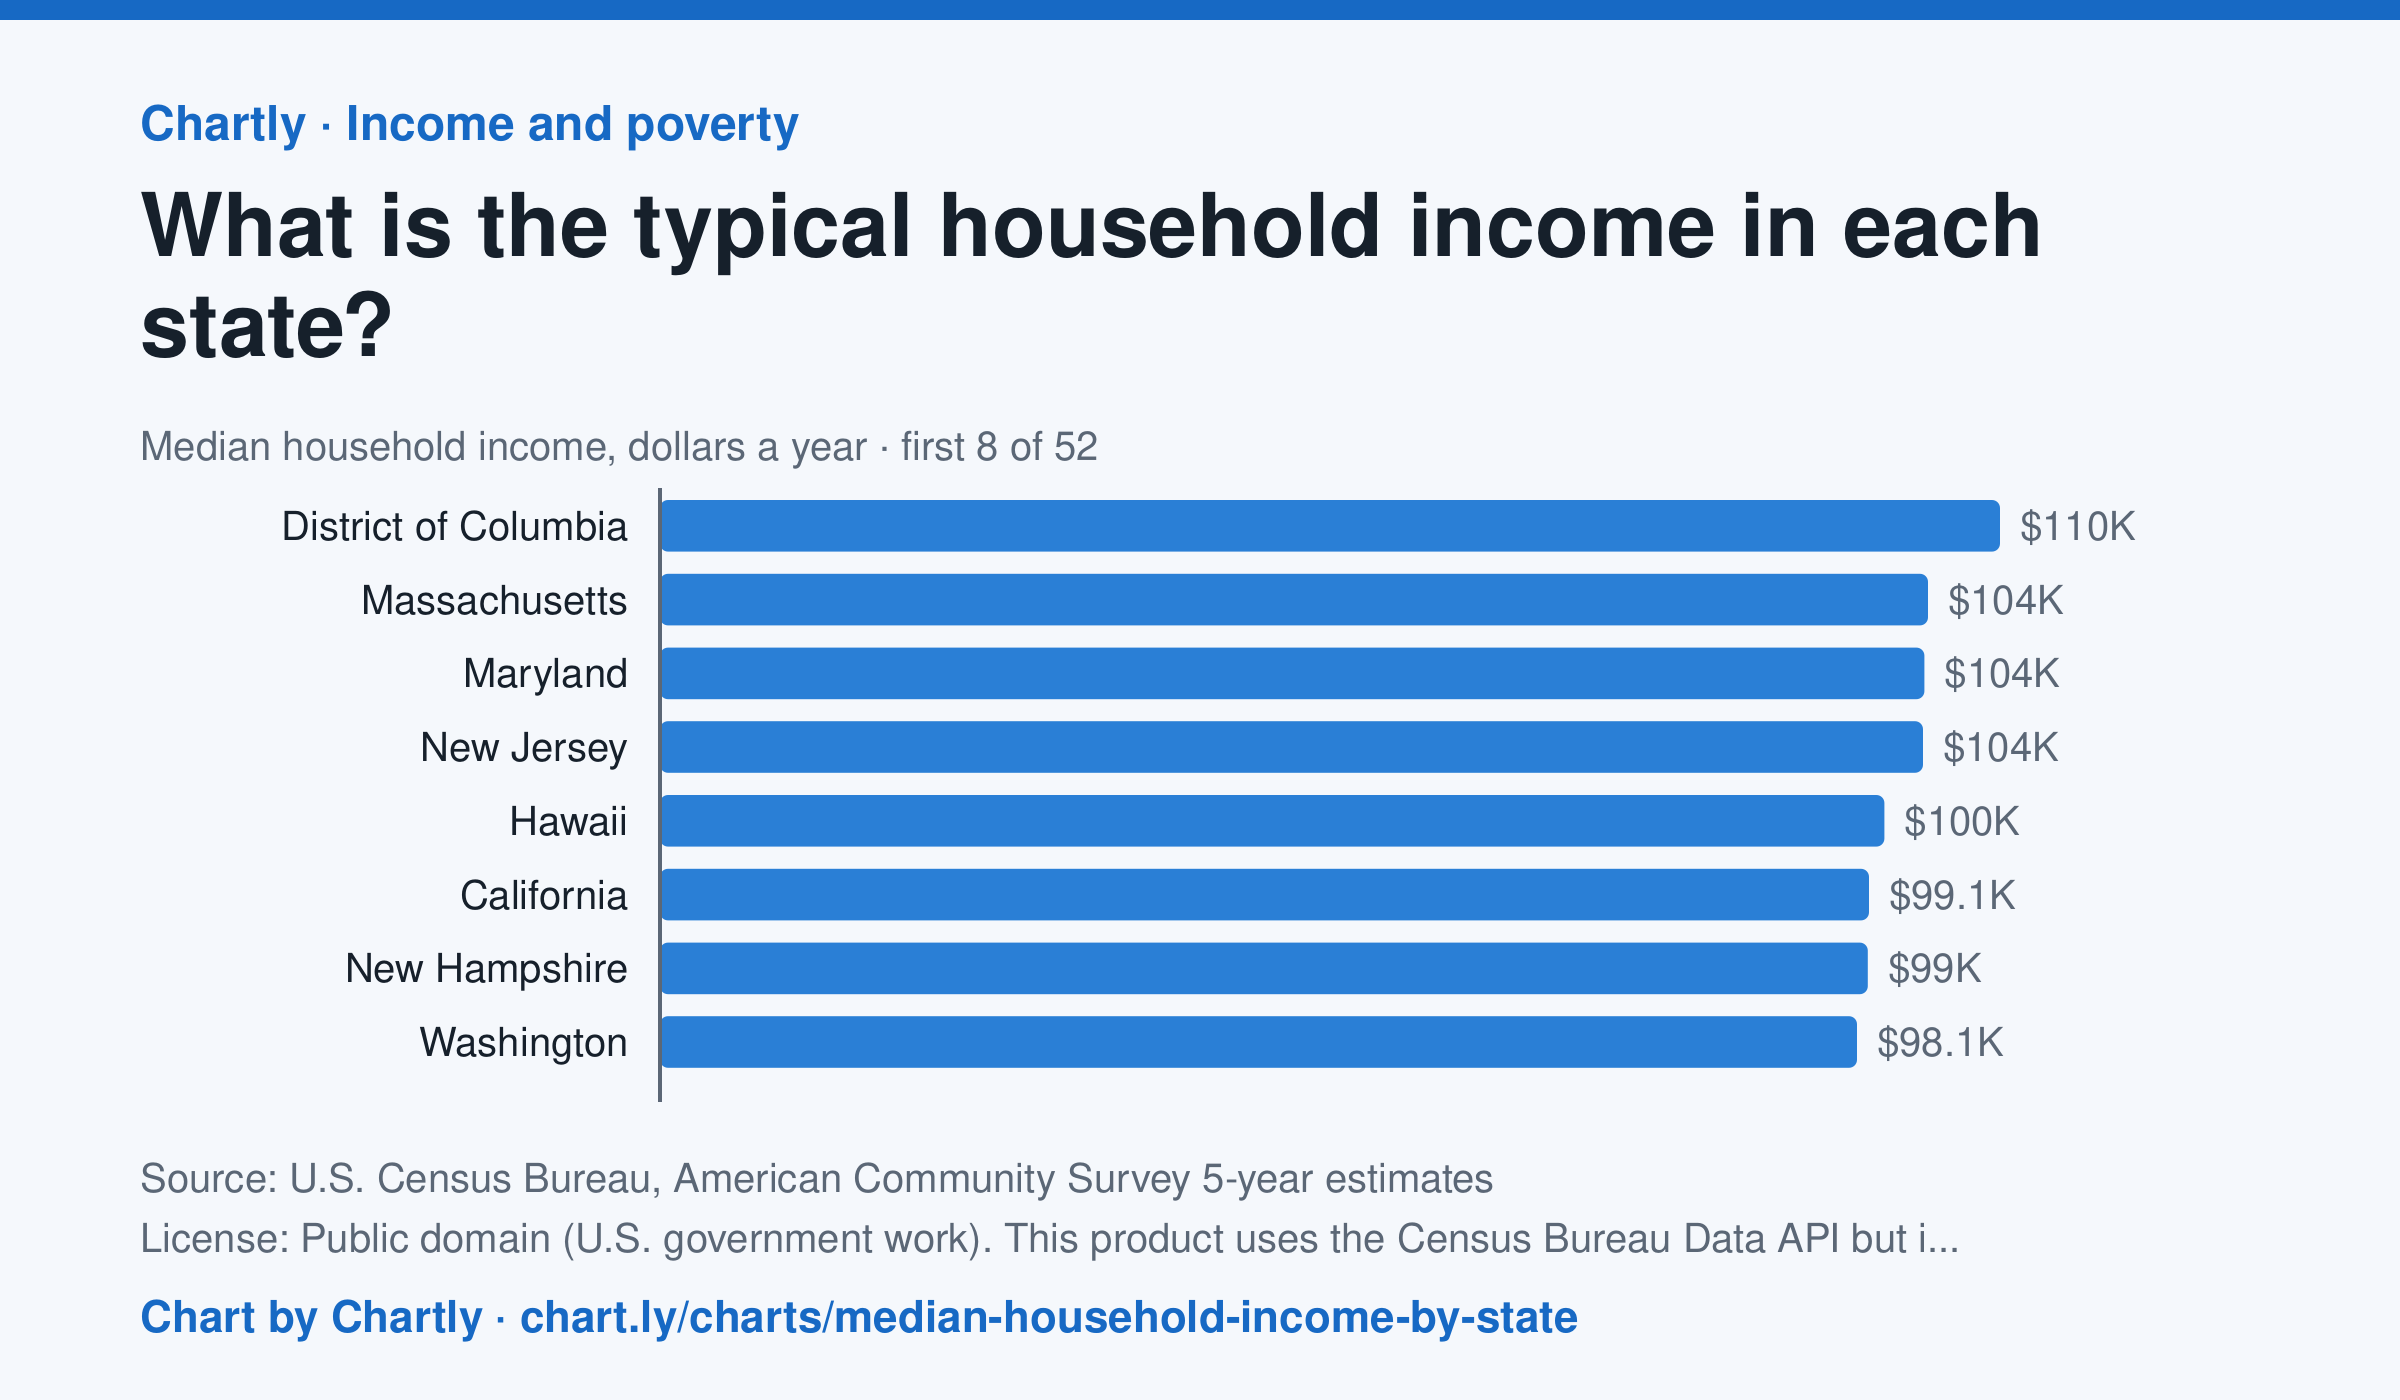
In the Census Bureau's 5-year survey ending in 2024, the typical household in District of Columbia earned $109,870 a year, the most, followed by Massachusetts ($103,960) and Maryland ($103,678). Mississippi was lowest at $56,447, and the U.S. median was $80,734. These are 5-year estimates in 2024 dollars, each with a margin of error.
Chart and numbers: chart.ly/charts/median-household-income-by-state · Source: U.S. Census Bureau, American Community Survey 5-year estimates (Public domain (U.S. government work). This product uses the Census Bureau Data API but is not endorsed or certified by the Census Bureau.) · Data as of Dec 31, 2024