The teacher's answer key. Students' scales may differ; any even scale that starts at 0 and fits the biggest number is right.
Answer key · graphing practice
Draw a bar graph: GDP per person
A title such as "How rich is each country, per person?". Bottom axis: Country. Side axis: GDP per person, US dollars, from 0 to 500,000, going up by 50,000 on each dark line.
| Country | GDP per person, US dollars |
|---|---|
| Monaco | 288,000 |
| Liechtenstein | 220,000 |
| Bermuda | 142,000 |
| Luxembourg | 138,000 |
| Ireland | 113,000 |
| Switzerland | 108,000 |
| Cayman Islands | 104,000 |
| Singapore | 95,000 |
| Norway | 90,000 |
| United States | 86,000 |
The 10 highest of the 200 on the chart. Numbers are rounded to make them easier to plot. Source: World Bank, World Development Indicators: GDP per capita (current US$) (CC BY 4.0 (credit the World Bank)) · Data as of Dec 31, 2024
The finished Chartly chart
Every number the source has, not only the table's rows.
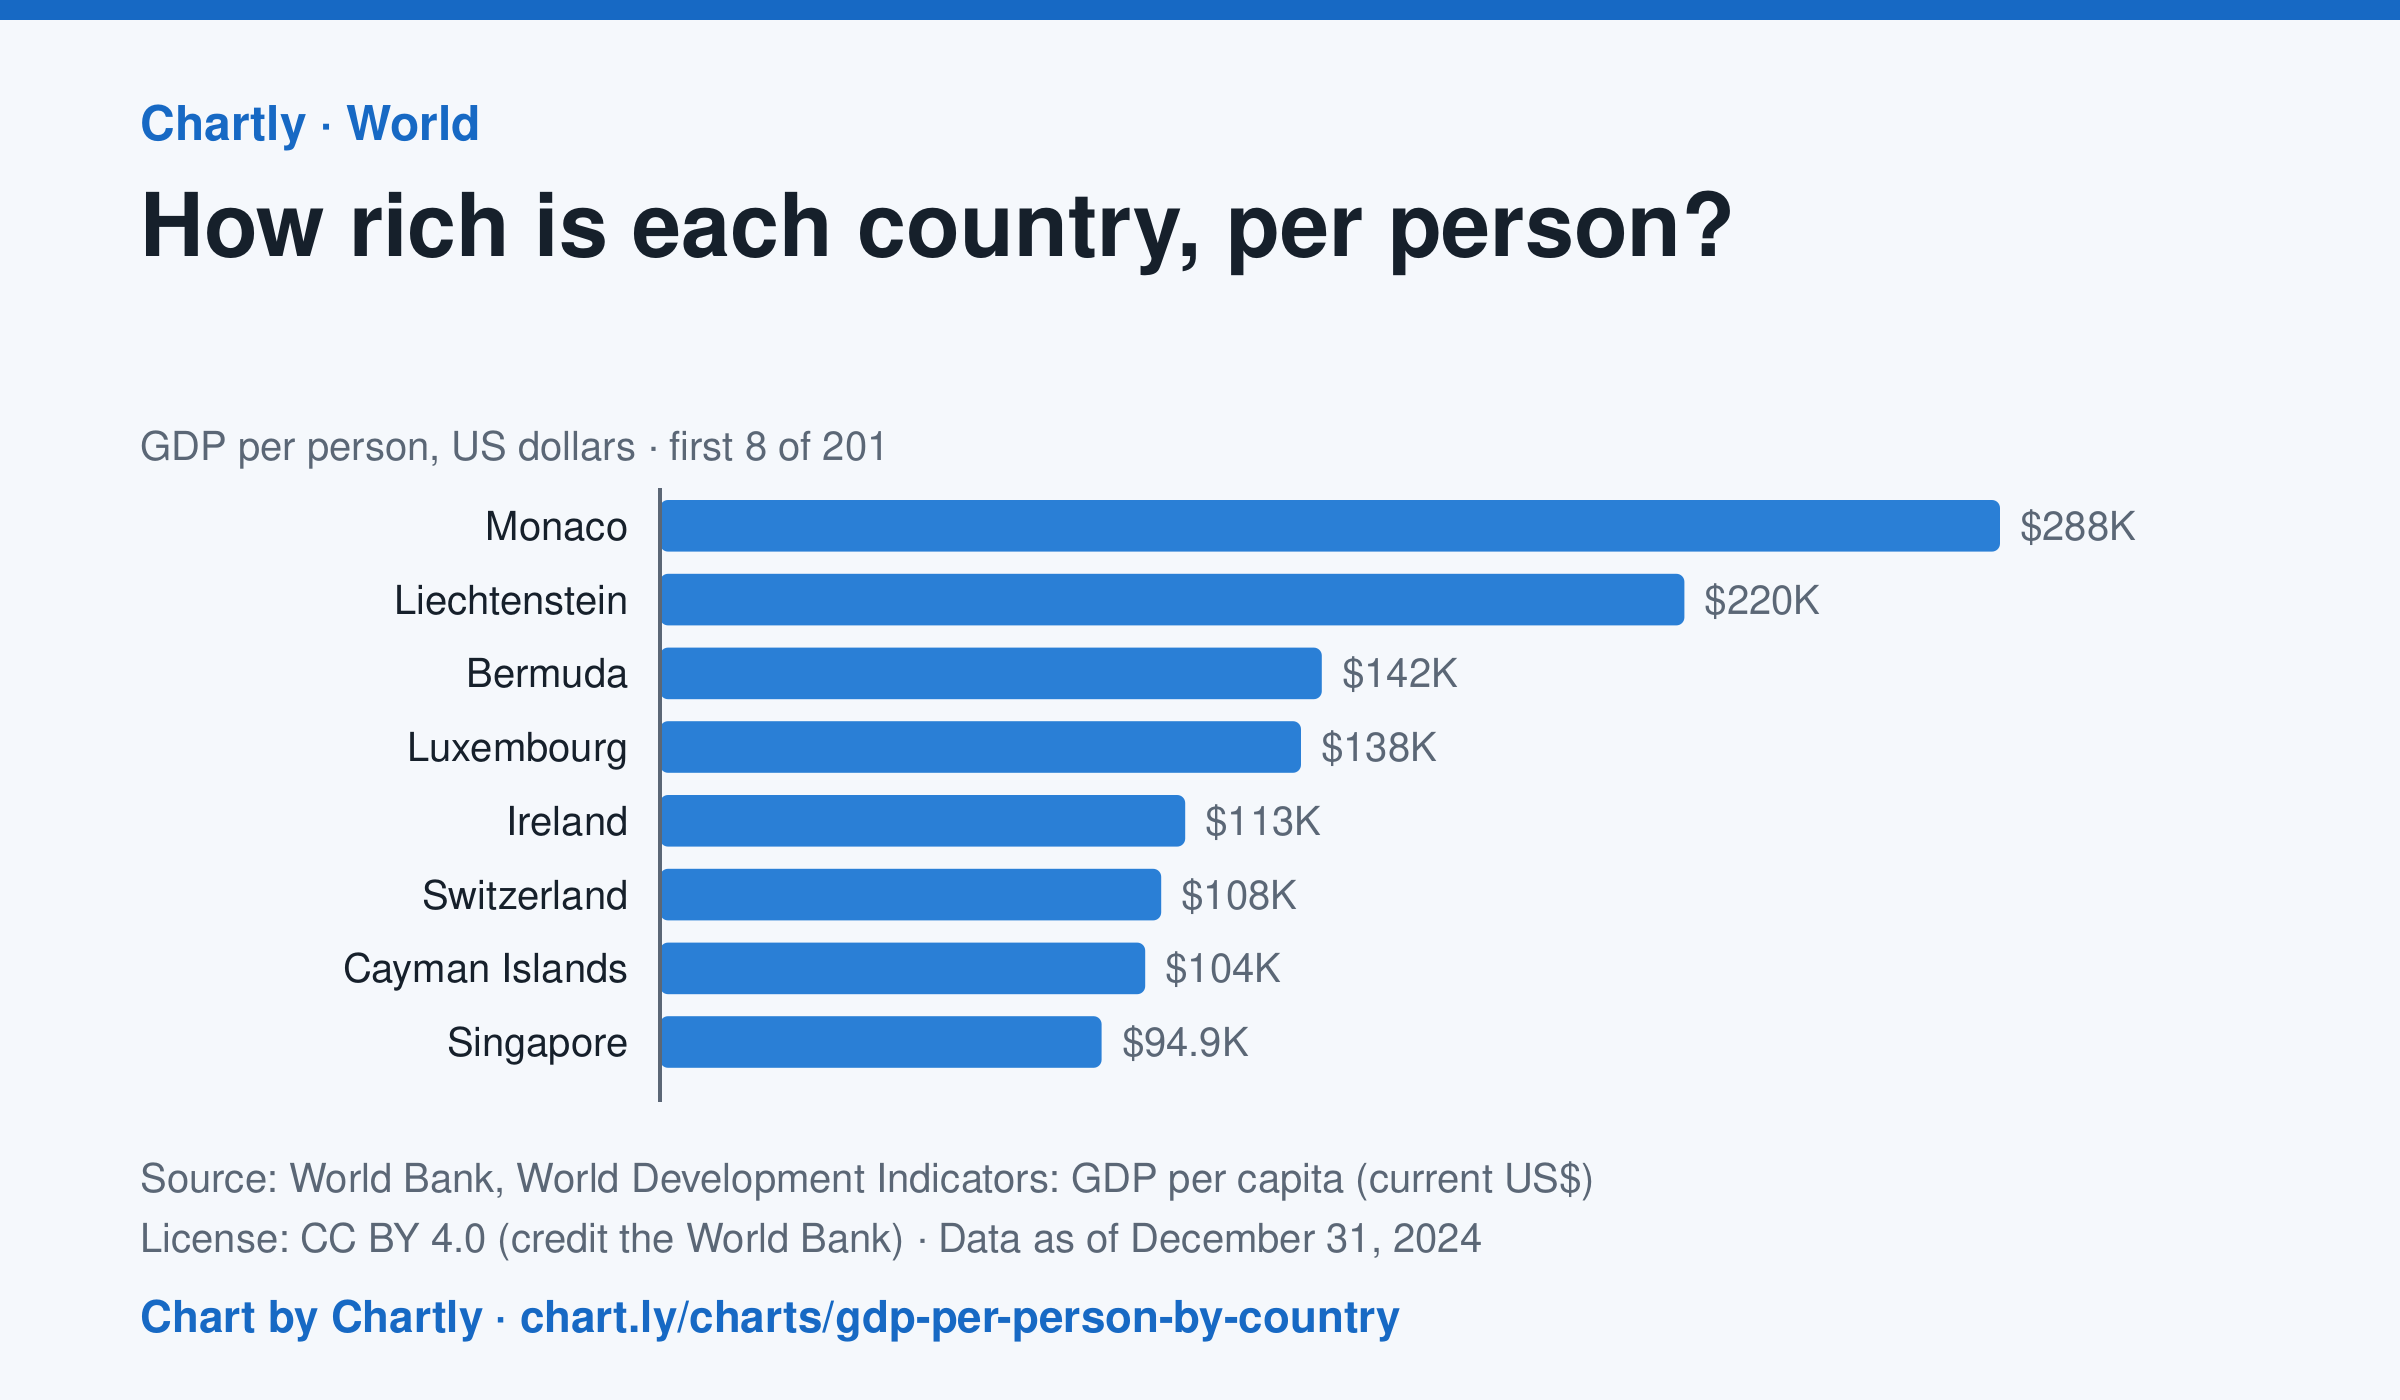
In 2024, Monaco produced the most goods and services (GDP) per person, $288,002, and Burundi the least, $216; the United States was at $86,170, China at $13,293 and India at $2,592. Search 200 countries and territories. Figures are in US dollars at each year's exchange rates, not adjusted for differences in prices, and places that hadn't reported 2024 are left out.
Chart and numbers: chart.ly/charts/gdp-per-person-by-country · Source: World Bank, World Development Indicators: GDP per capita (current US$) (CC BY 4.0 (credit the World Bank)) · Data as of Dec 31, 2024