The teacher's answer key. Students' scales may differ; any even scale that starts at 0 and fits the biggest number is right.
Answer key · graphing practice
Draw a line graph: gas prices
A title such as "How much has a gallon of gas cost in the US since 1990?". Bottom axis: Month. Side axis: Dollars per gallon, regular gasoline, from 0 to 5, going up by 0.5 on each dark line.
| Month | Dollars per gallon, regular gasoline |
|---|---|
| Oct 1996 | 1.2 |
| Oct 2006 | 2.25 |
| Oct 2016 | 2.25 |
| Oct 2026 | 4.31 |
Every few years from the chart, ending with the newest. Numbers are rounded to make them easier to plot. Source: U.S. Energy Information Administration, Gasoline and Diesel Fuel Update (Public domain (U.S. government work)) · Data as of Oct 31, 2026
The finished Chartly chart
Every number the source has, not only the table's rows.
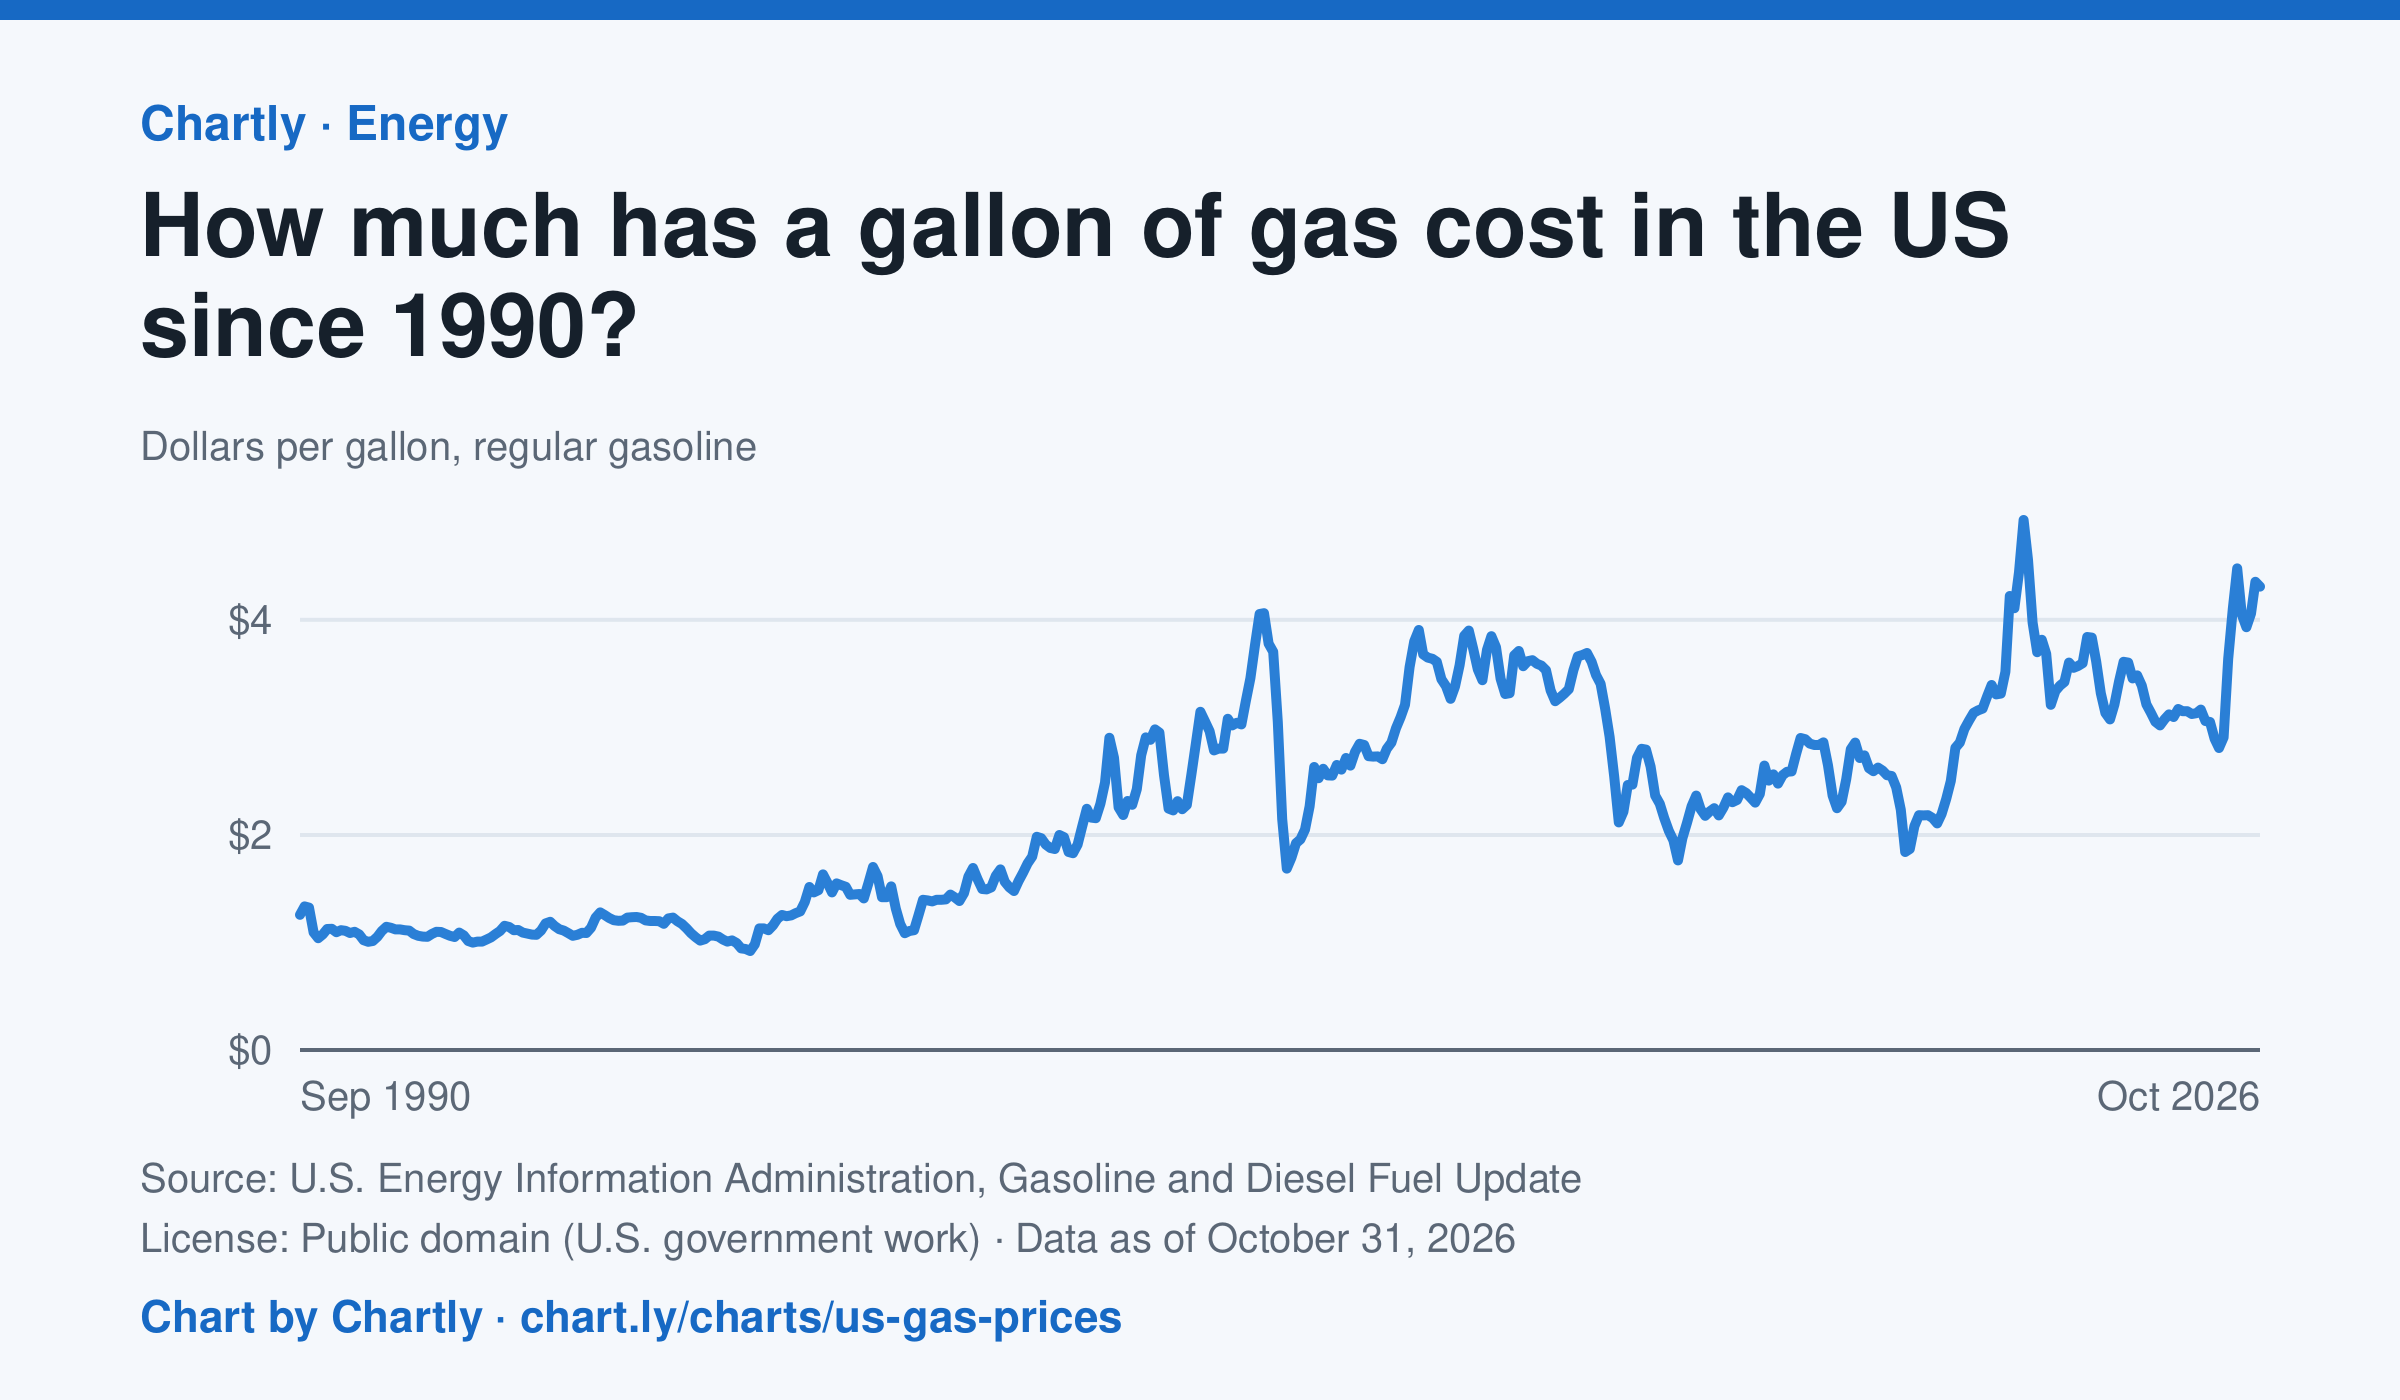
Regular gas averaged $4.31 a gallon in October 2026. The monthly average peaked at $4.93 in June 2022 and was lowest at $0.92 in February 1999. Each point averages EIA's weekly survey of gas stations nationwide, taxes included, in dollars of the day, not adjusted for inflation.
Chart and numbers: chart.ly/charts/us-gas-prices · Source: U.S. Energy Information Administration, Gasoline and Diesel Fuel Update (Public domain (U.S. government work)) · Data as of Oct 31, 2026