The teacher's answer key. Students' scales may differ; any even scale that starts at 0 and fits the biggest number is right.
Answer key · graphing practice
Draw a bar graph: federal revenue
A title such as "Where does federal revenue come from?". Bottom axis: Source. Side axis: Receipts in US dollars, in trillions, from 0 to 5, going up by 0.5 on each dark line.
| Source | Receipts in US dollars, in trillions |
|---|---|
| Individual Income Taxes | 2.85 |
| Social Insurance and Retirement Receipts | 1.81 |
| Corporation Income Taxes | 0.38 |
| Customs Duties | 0.17 |
| Excise Taxes | 0.11 |
| Miscellaneous Receipts | 0.05 |
| Estate and Gift Taxes | 0.04 |
Every bar on the chart. Numbers are rounded to make them easier to plot. Source: U.S. Treasury Fiscal Data, Monthly Treasury Statement (Table 9) (Public domain (U.S. government work)) · Data as of Sep 30, 2026
The finished Chartly chart
Every number the source has, not only the table's rows.
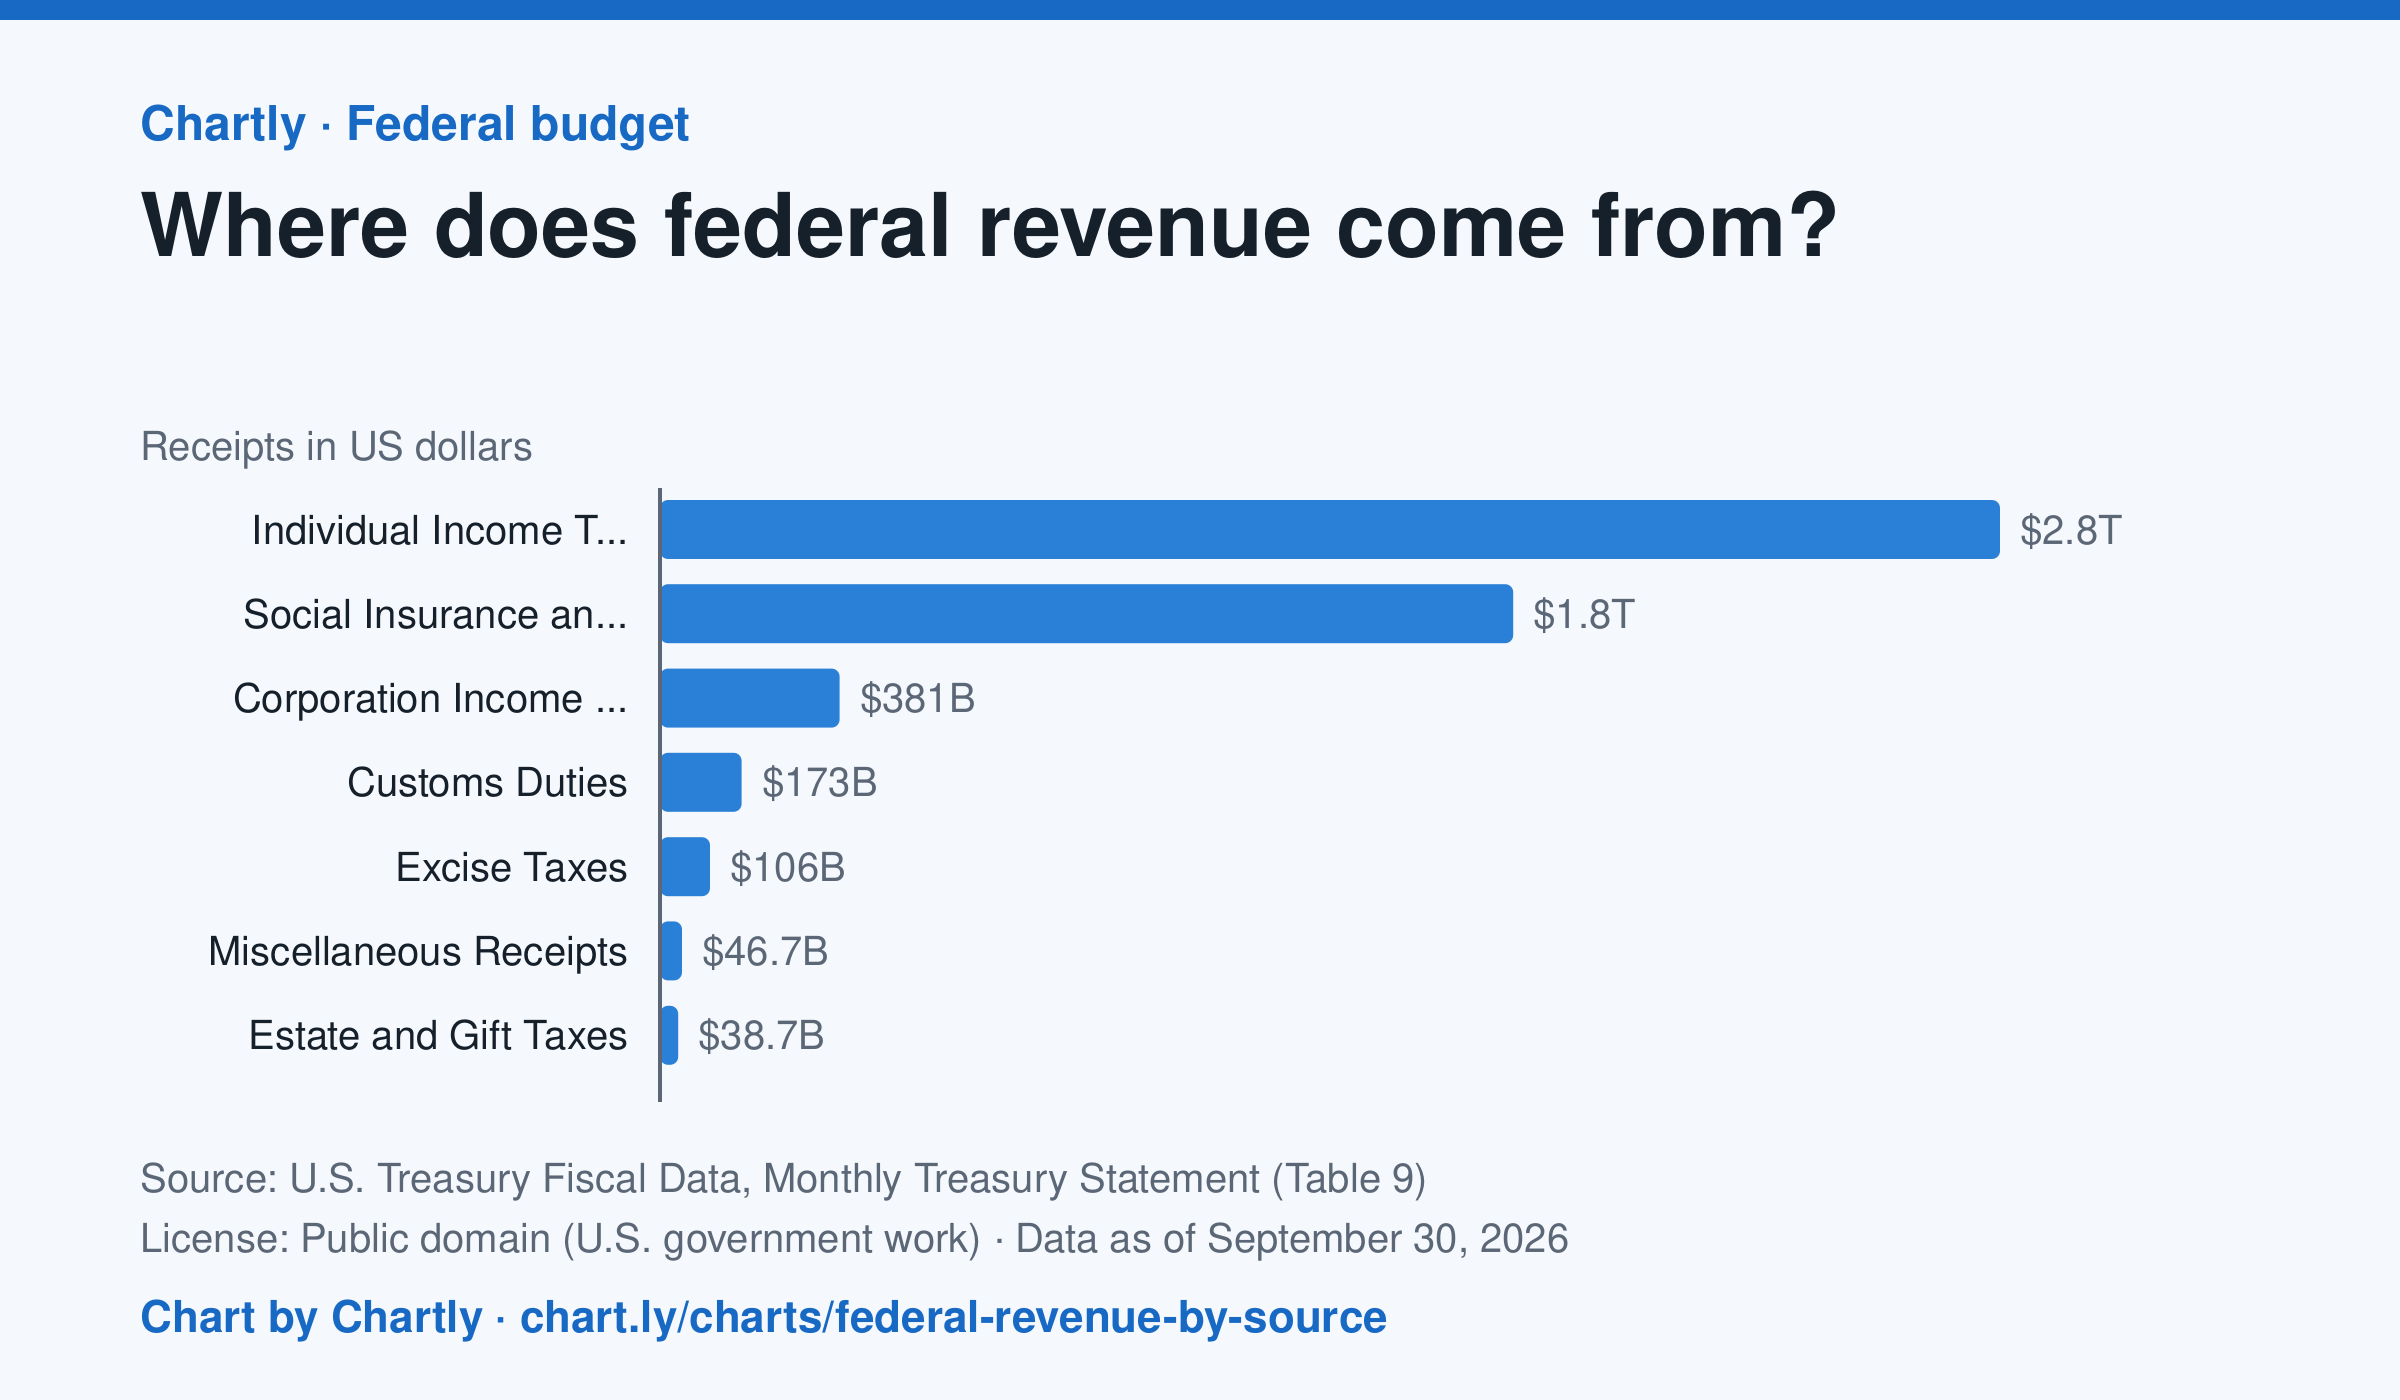
Individual income taxes brought in $2.85 trillion of the government's $5.4 trillion in fiscal 2026, about 53%. Payroll taxes for Social Security, Medicare and unemployment insurance ("social insurance") added $1.81 trillion, and corporate income taxes $381 billion.
Chart and numbers: chart.ly/charts/federal-revenue-by-source · Source: U.S. Treasury Fiscal Data, Monthly Treasury Statement (Table 9) (Public domain (U.S. government work)) · Data as of Sep 30, 2026