The teacher's answer key. Students' scales may differ; any even scale that starts at 0 and fits the biggest number is right.
Answer key · graphing practice
Draw a line graph: drug overdose deaths
A title such as "How many Americans die of drug overdoses each year?". Bottom axis: 12 months ending. Side axis: Drug overdose deaths in the previous 12 months, from 0 to 200,000, going up by 20,000 on each dark line.
| 12 months ending | Drug overdose deaths in the previous 12 months |
|---|---|
| Jun 2016 | 57,000 |
| Jun 2018 | 69,000 |
| Jun 2020 | 83,000 |
| Jun 2022 | 107,000 |
| Jun 2024 | 96,000 |
| Jun 2026 | 64,000 |
Every few years from the chart, ending with the newest. Numbers are rounded to make them easier to plot. Source: CDC National Center for Health Statistics, Provisional drug overdose death counts (Public domain (U.S. government work)) · Data as of Jun 30, 2026
The finished Chartly chart
Every number the source has, not only the table's rows.
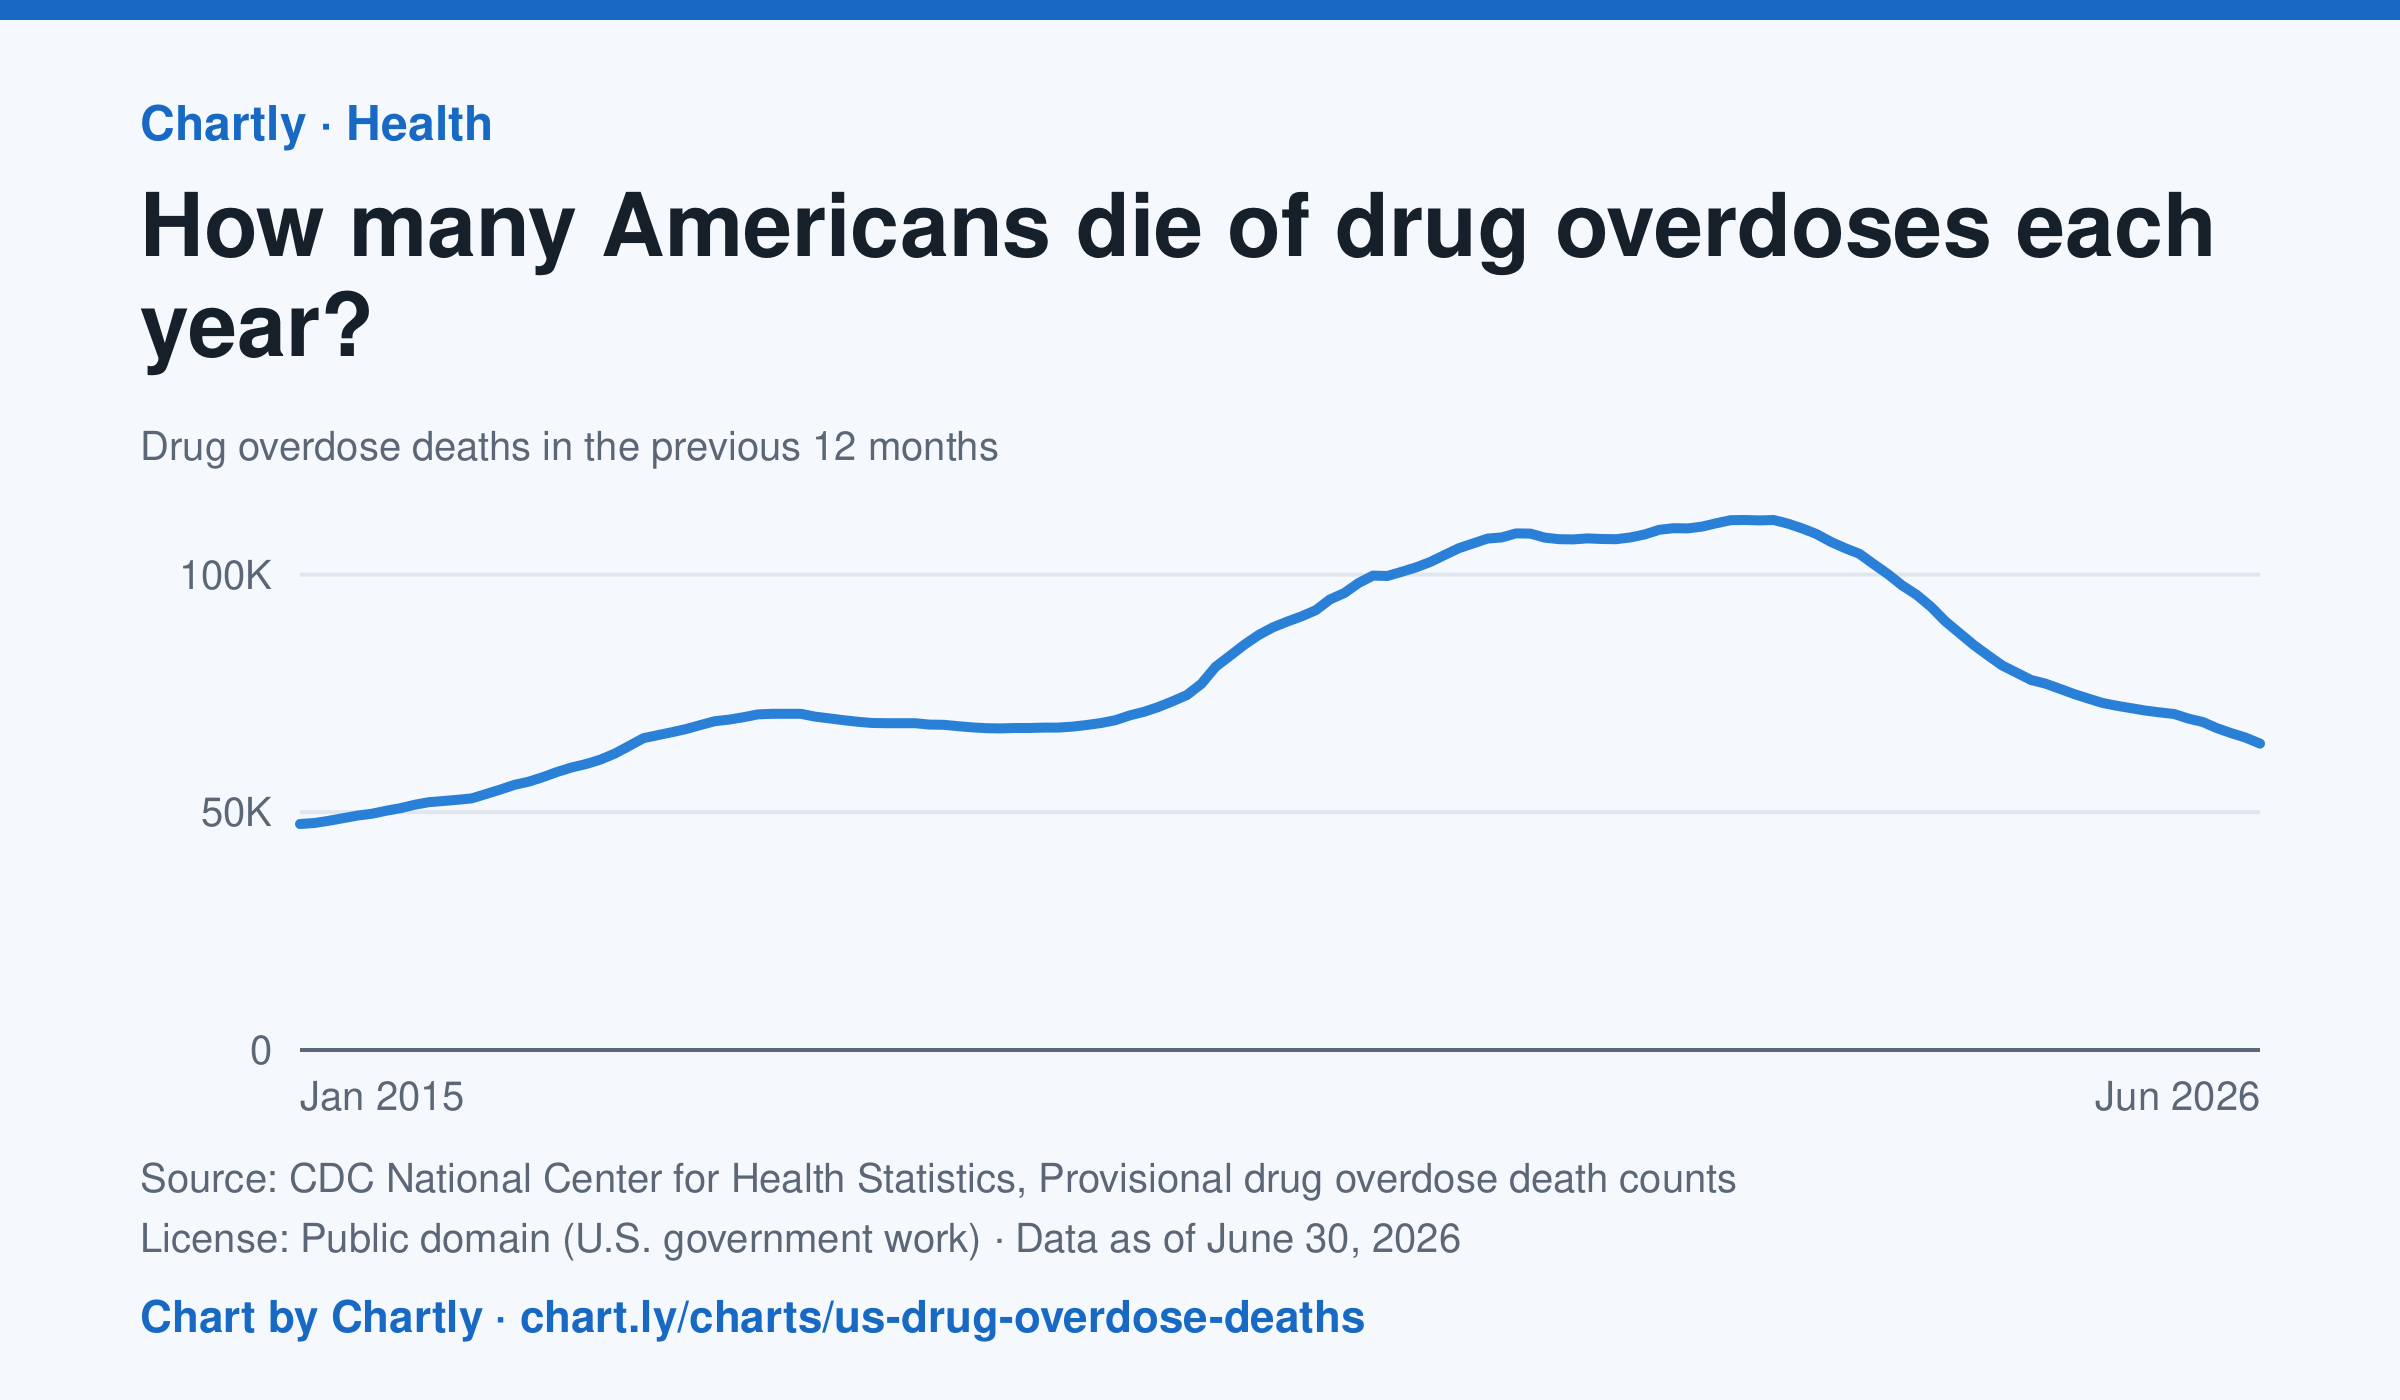
64,433 people died of drug overdoses in the US in the 12 months ending June 2026, about 42% fewer than at the peak of about 111,500 in the 12 months ending June 2023. The counts are provisional: the latest months are slightly undercounted while some causes of death are still being investigated. CDC's provisional counts start with the 12 months ending January 2015.
Chart and numbers: chart.ly/charts/us-drug-overdose-deaths · Source: CDC National Center for Health Statistics, Provisional drug overdose death counts (Public domain (U.S. government work)) · Data as of Jun 30, 2026