The teacher's answer key. Students' scales may differ; any even scale that starts at 0 and fits the biggest number is right.
Answer key · graphing practice
Draw a line graph: consumer price index
A title such as "How much have US consumer prices risen since 1913?". Bottom axis: Month. Side axis: Consumer Price Index (1982–84 average = 100), from 0 to 500, going up by 50 on each dark line.
| Month | Consumer Price Index (1982–84 average = 100) |
|---|---|
| Oct 1926 | 18 |
| Oct 1946 | 21 |
| Oct 1966 | 33 |
| Oct 1986 | 110 |
| Oct 2006 | 202 |
| Oct 2026 | 338 |
Every few years from the chart, ending with the newest. Numbers are rounded to make them easier to plot. Source: U.S. Bureau of Labor Statistics, Consumer Price Index (CPI-U, all items) (Public domain (U.S. government work)) · Data as of Oct 31, 2026
The finished Chartly chart
Every number the source has, not only the table's rows.
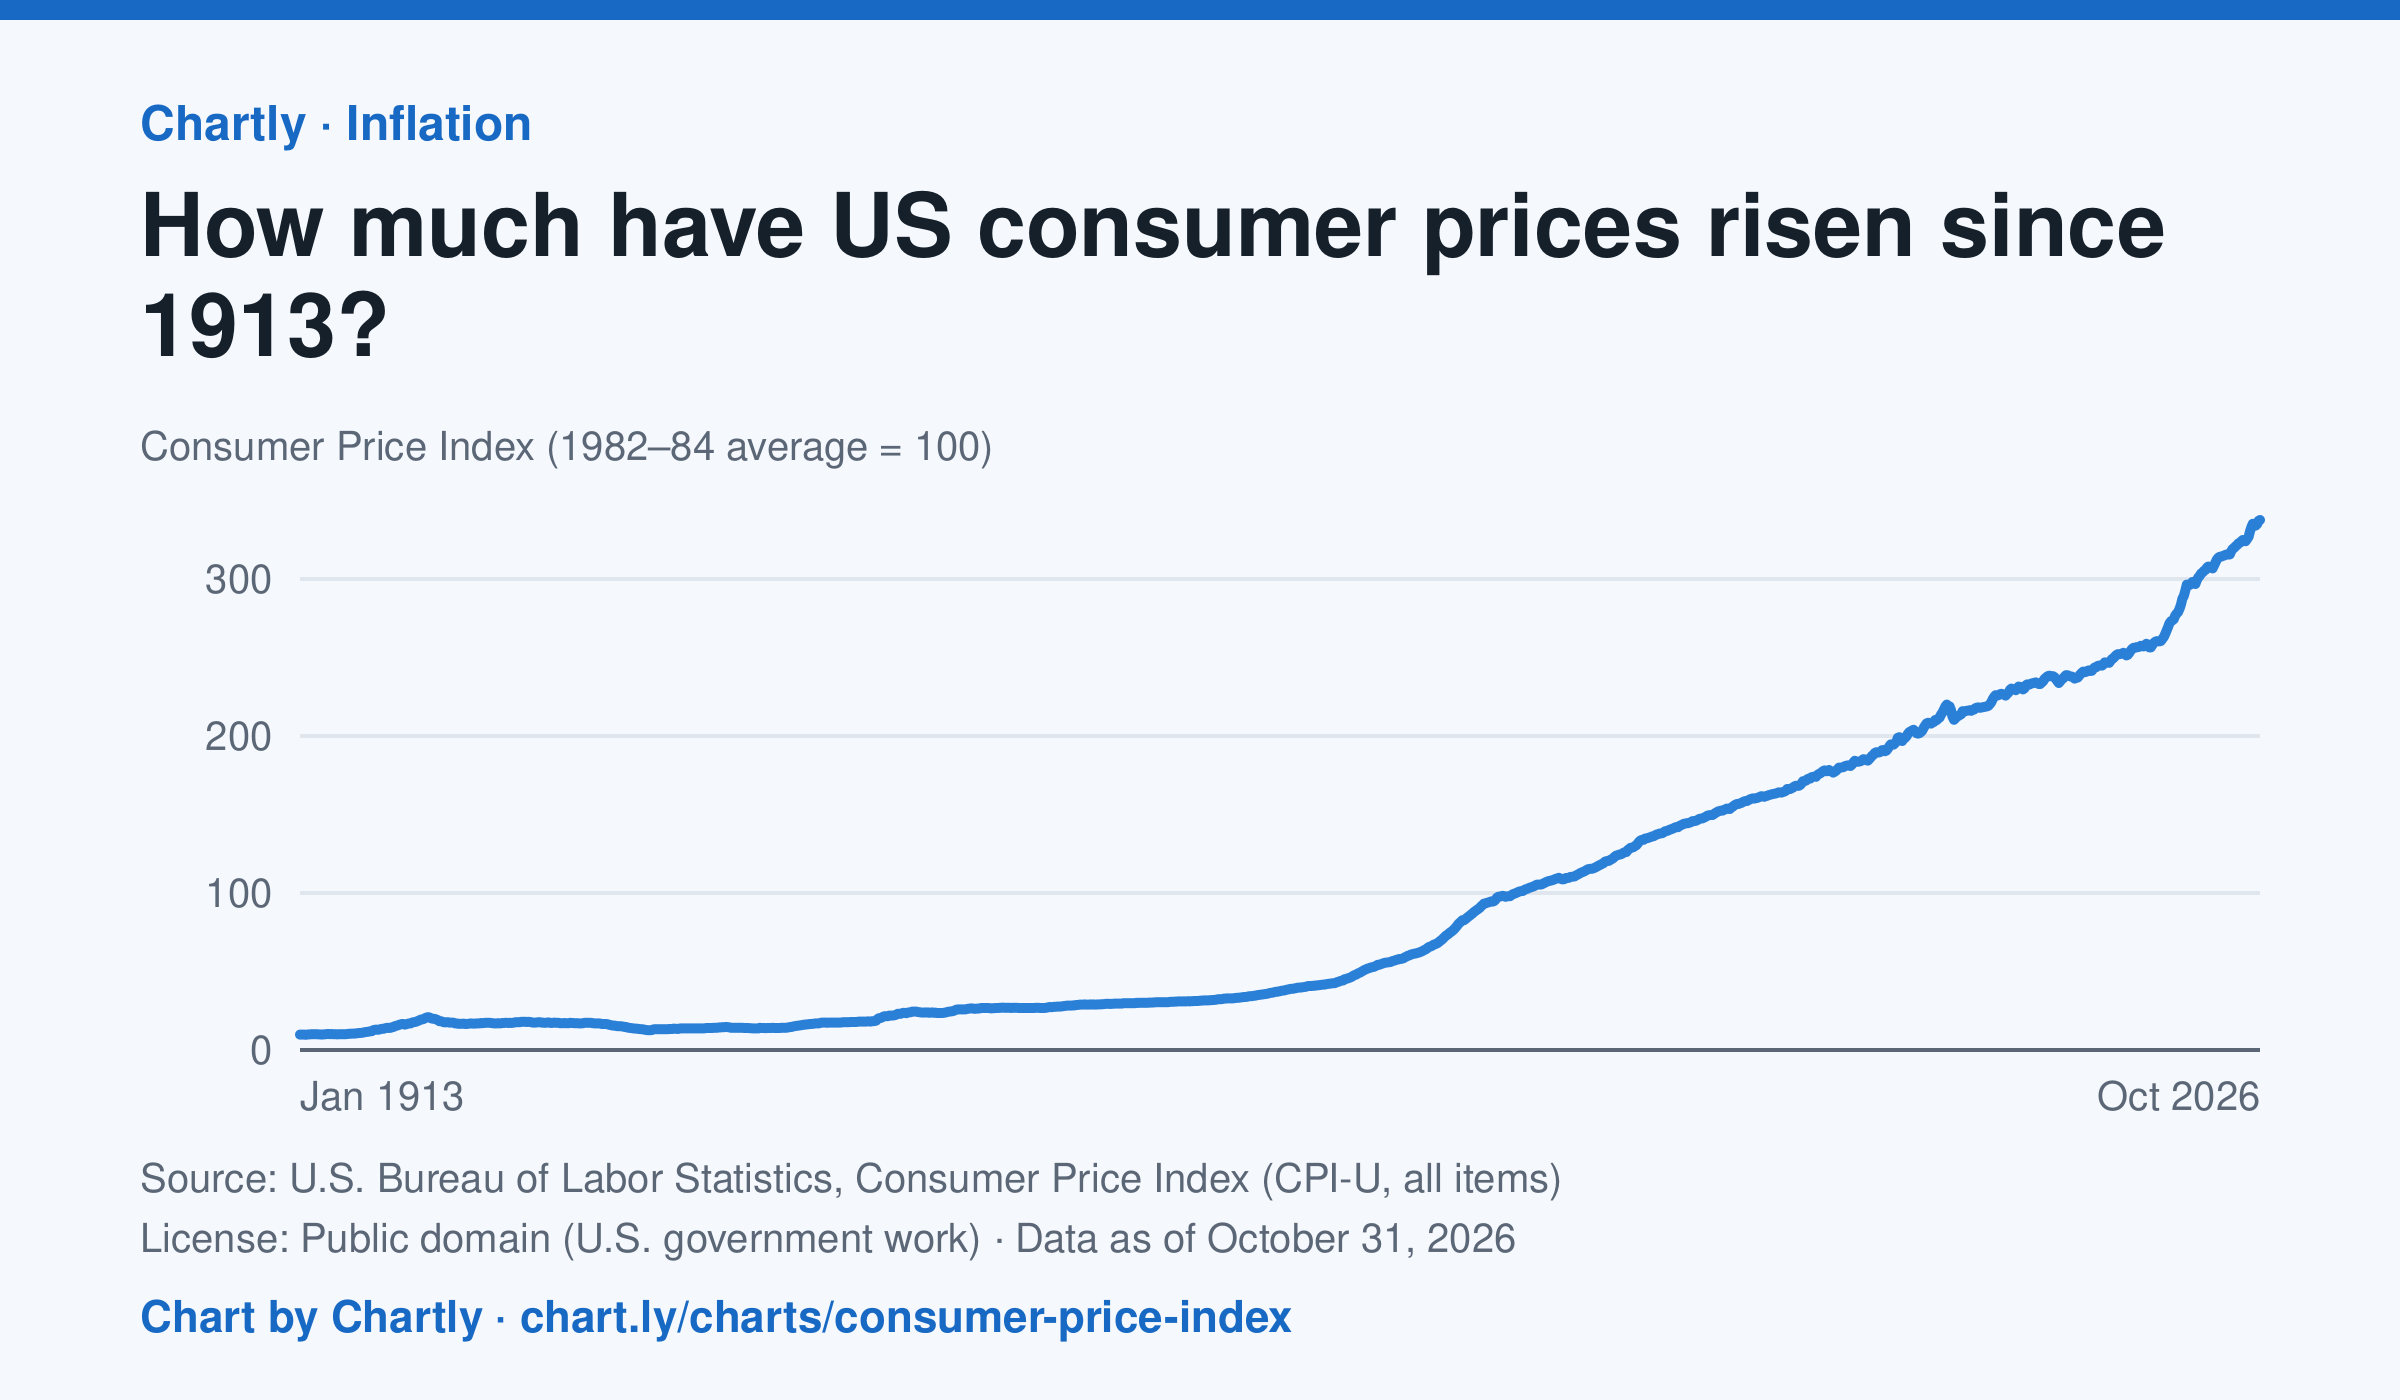
Consumer prices in October 2026 were 34 times their level in January 1913, when the Consumer Price Index begins: what cost $1 then cost about $34 in 2026. They were 2 times their level of January 2000. The index tracks what a typical basket of goods and services costs city households, with 100 as its 1982–84 average. Prices fell after 1920 and again in the early 1930s. October 2025 is missing because BLS collected no prices that month, during a lapse in federal funding.
Chart and numbers: chart.ly/charts/consumer-price-index · Source: U.S. Bureau of Labor Statistics, Consumer Price Index (CPI-U, all items) (Public domain (U.S. government work)) · Data as of Oct 31, 2026