The teacher's answer key. Students' scales may differ; any even scale that starts at 0 and fits the biggest number is right.
Answer key · graphing practice
Draw a bar graph: causes of death
A title such as "What do Americans die of most often?". Bottom axis: Cause of death. Side axis: Deaths per 100,000 people in a year, from 0 to 250, going up by 25 on each dark line.
| Cause of death | Deaths per 100,000 people in a year |
|---|---|
| Heart disease | 204 |
| Cancer | 183 |
| Unintentional injuries | 56 |
| Stroke | 50 |
| Chronic lower respiratory diseases | 44 |
| Alzheimer disease | 35 |
| Diabetes | 28 |
| Influenza and pneumonia | 17 |
| Kidney disease | 17 |
| Chronic liver disease and cirrhosis | 15 |
Every bar on the chart. Numbers are rounded to make them easier to plot. Source: CDC National Center for Health Statistics, Quarterly provisional estimates of mortality (Public domain (U.S. government work)) · Data as of Jun 30, 2025
The finished Chartly chart
Every number the source has, not only the table's rows.
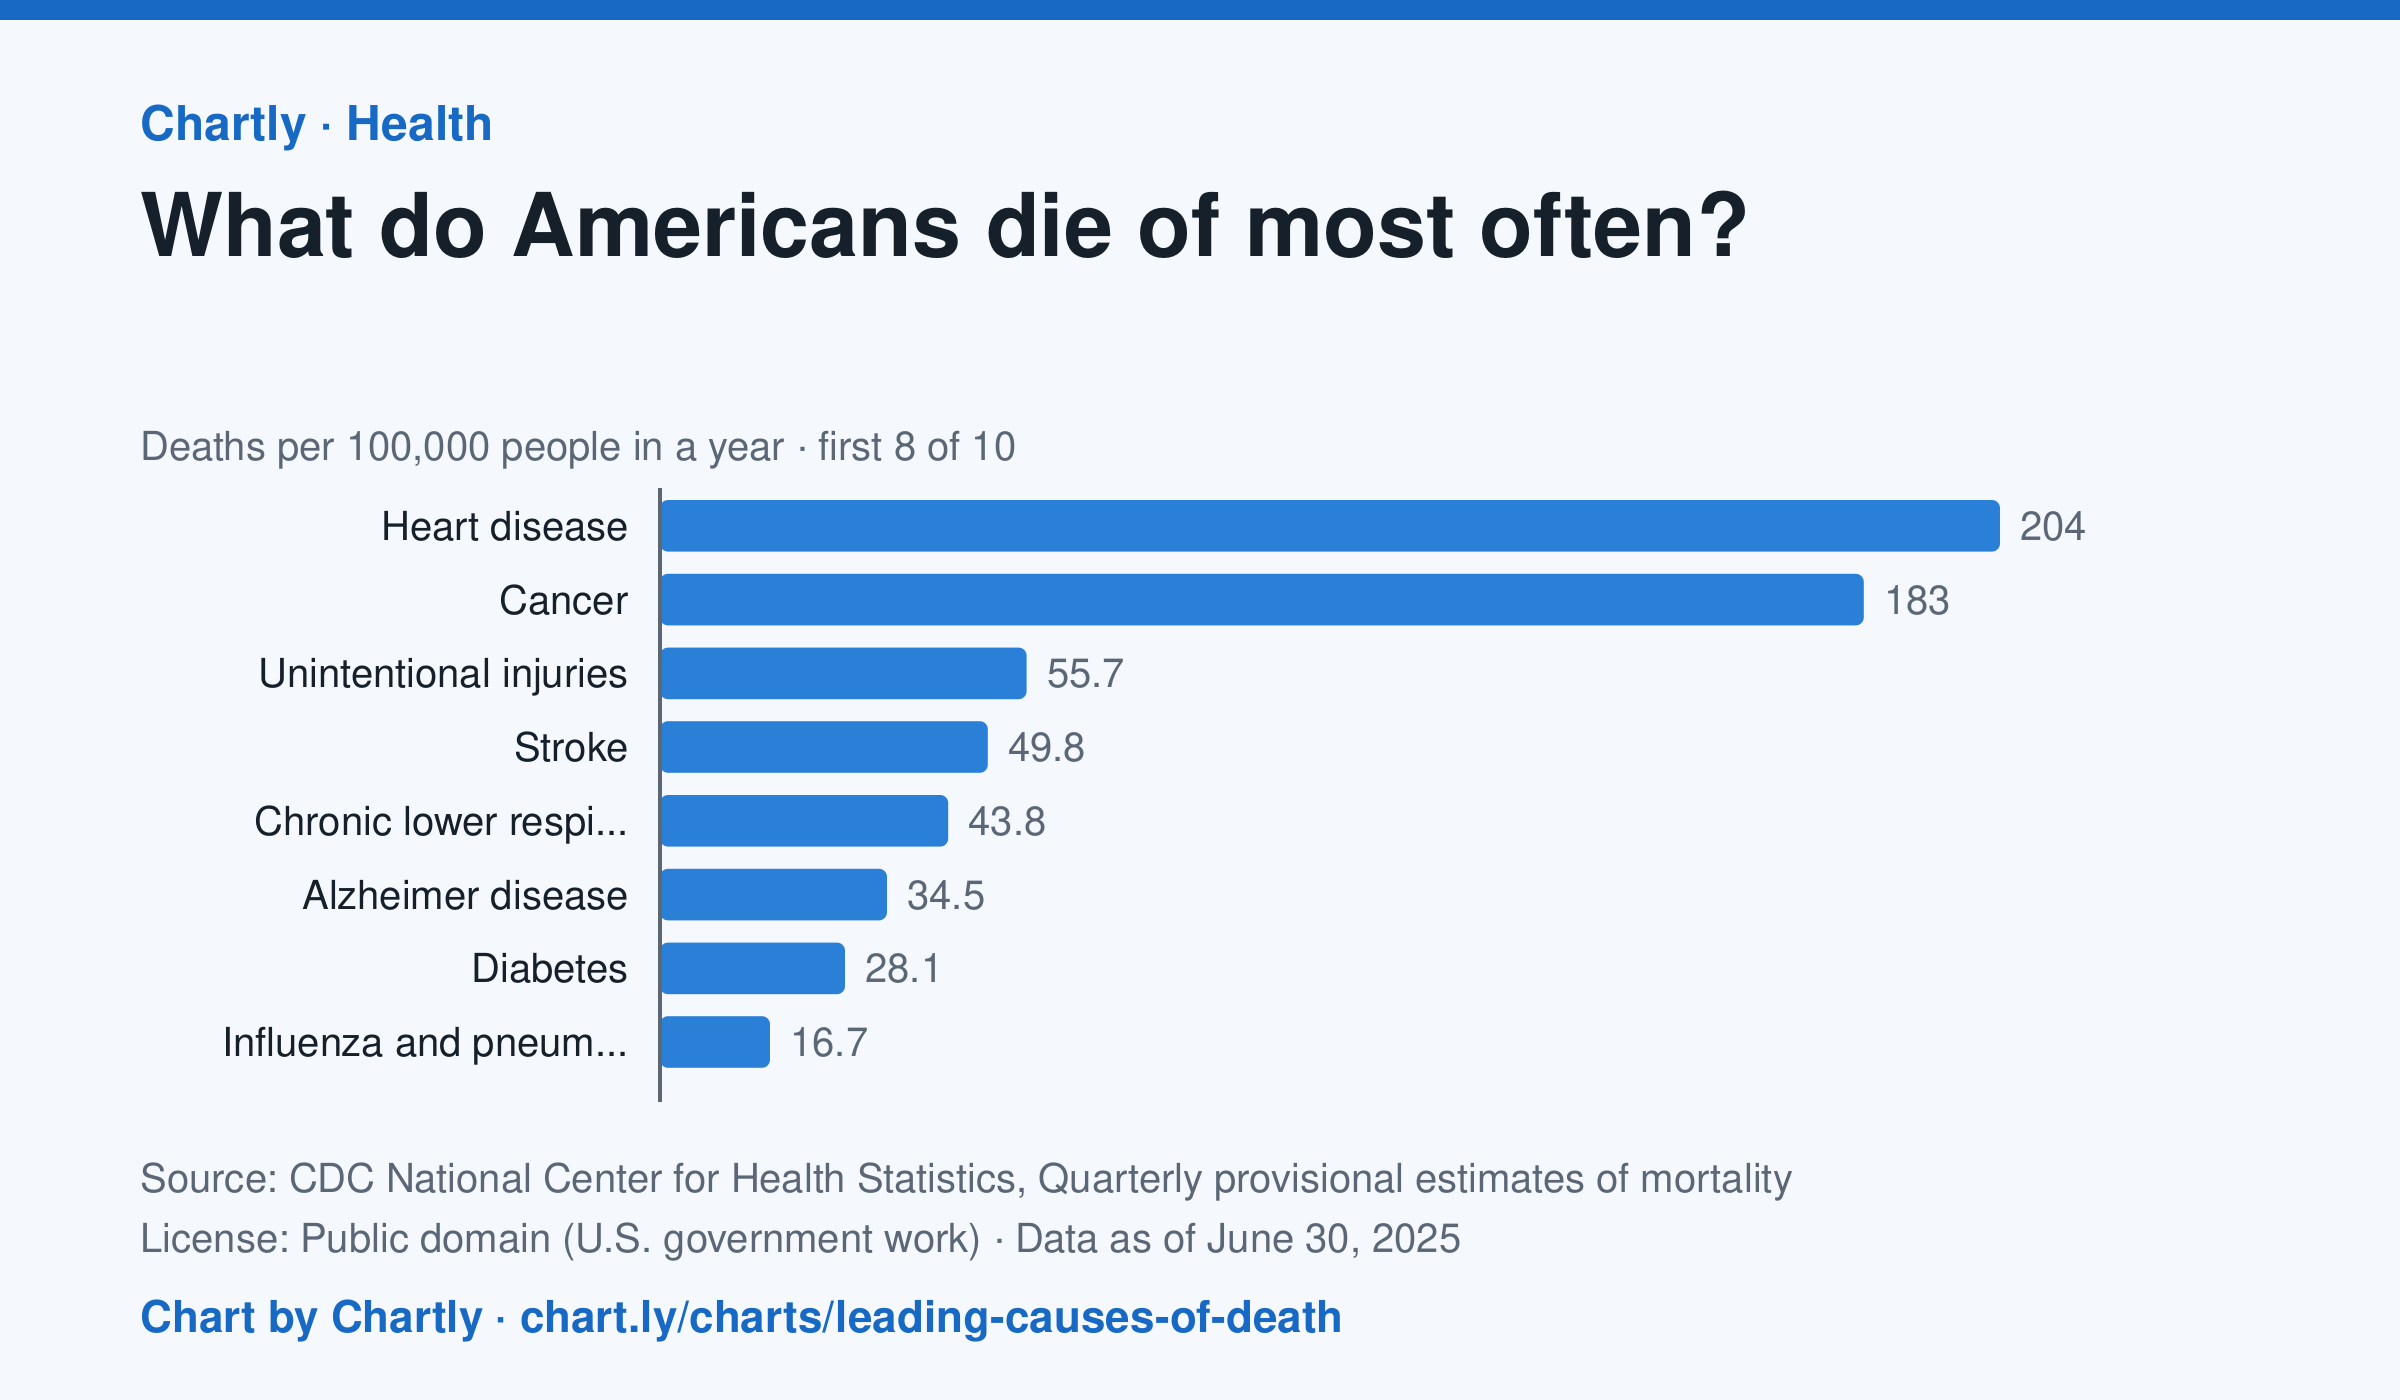
In the 12 months through June 2025, heart disease (204 deaths per 100,000 people) and cancer (183) were the leading causes of death in the US, and unintentional injuries came third at 56. Unintentional injuries include accidental overdoses, falls and traffic crashes. The numbers are provisional and may change a little as records are completed.
Chart and numbers: chart.ly/charts/leading-causes-of-death · Source: CDC National Center for Health Statistics, Quarterly provisional estimates of mortality (Public domain (U.S. government work)) · Data as of Jun 30, 2025