Print this worksheet, or choose "Save as PDF" in the print window to share a file.
Chart worksheet
AP Statistics chart assignment
Name:
Class:
Date:
Chart 1 of 2 · World
How has the world's population grown since 1960?
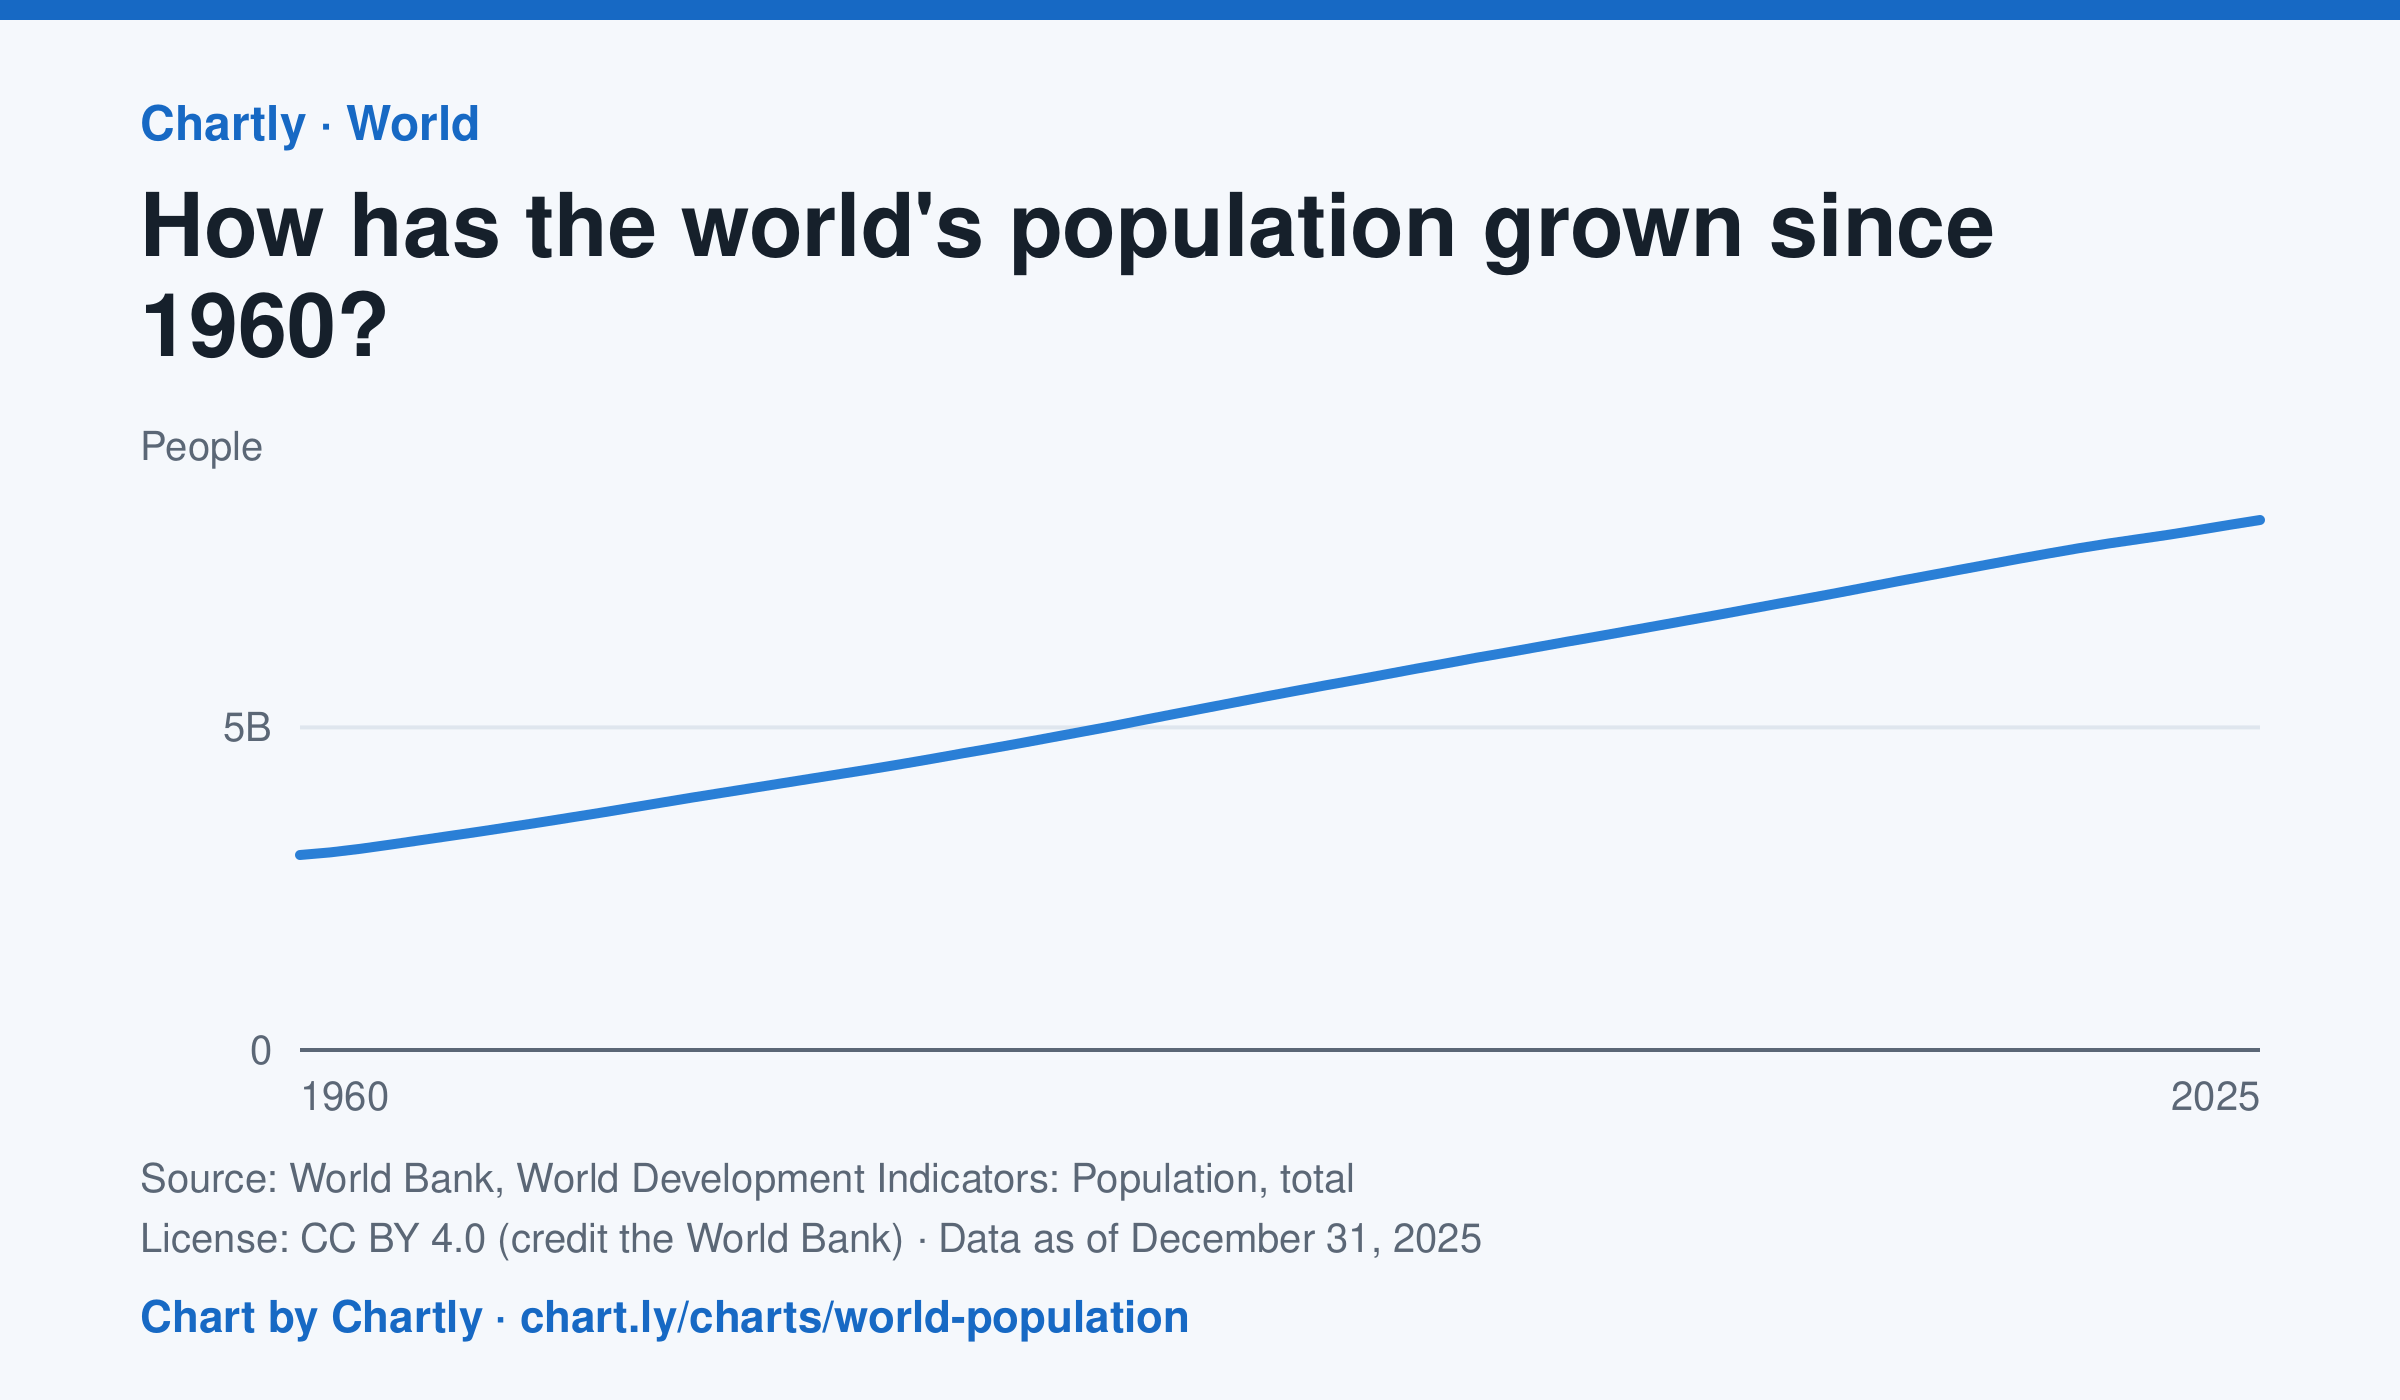
The world had 8.22 billion people in 2025, about 2.7 times the 3.02 billion of 1960. It passed 8 billion in 2023. Figures are mid-year estimates from the United Nations, which revises them as new censuses come in.
Source: World Bank, World Development Indicators: Population, total (CC BY 4.0 (credit the World Bank)) · Data as of Dec 31, 2025
How to read this chart
Each point is the number of people alive in the world in the middle of that year, estimated by the United Nations. The axis starts at zero, so the height of the line shows the true size. Look at how steep the line is to see how fast the population grew.
Questions
- Judging from the chart, about how many years did it take the world to add its most recent billion people?
- Is the line getting steeper or flatter in recent years? What does that tell you about the growth rate?
- These numbers are estimates that the UN revises. Why is it hard to count every person on Earth?
Chart and numbers: chart.ly/charts/world-population · More free charts at chart.ly
Chart 2 of 2 · World
How fast has the world come online?
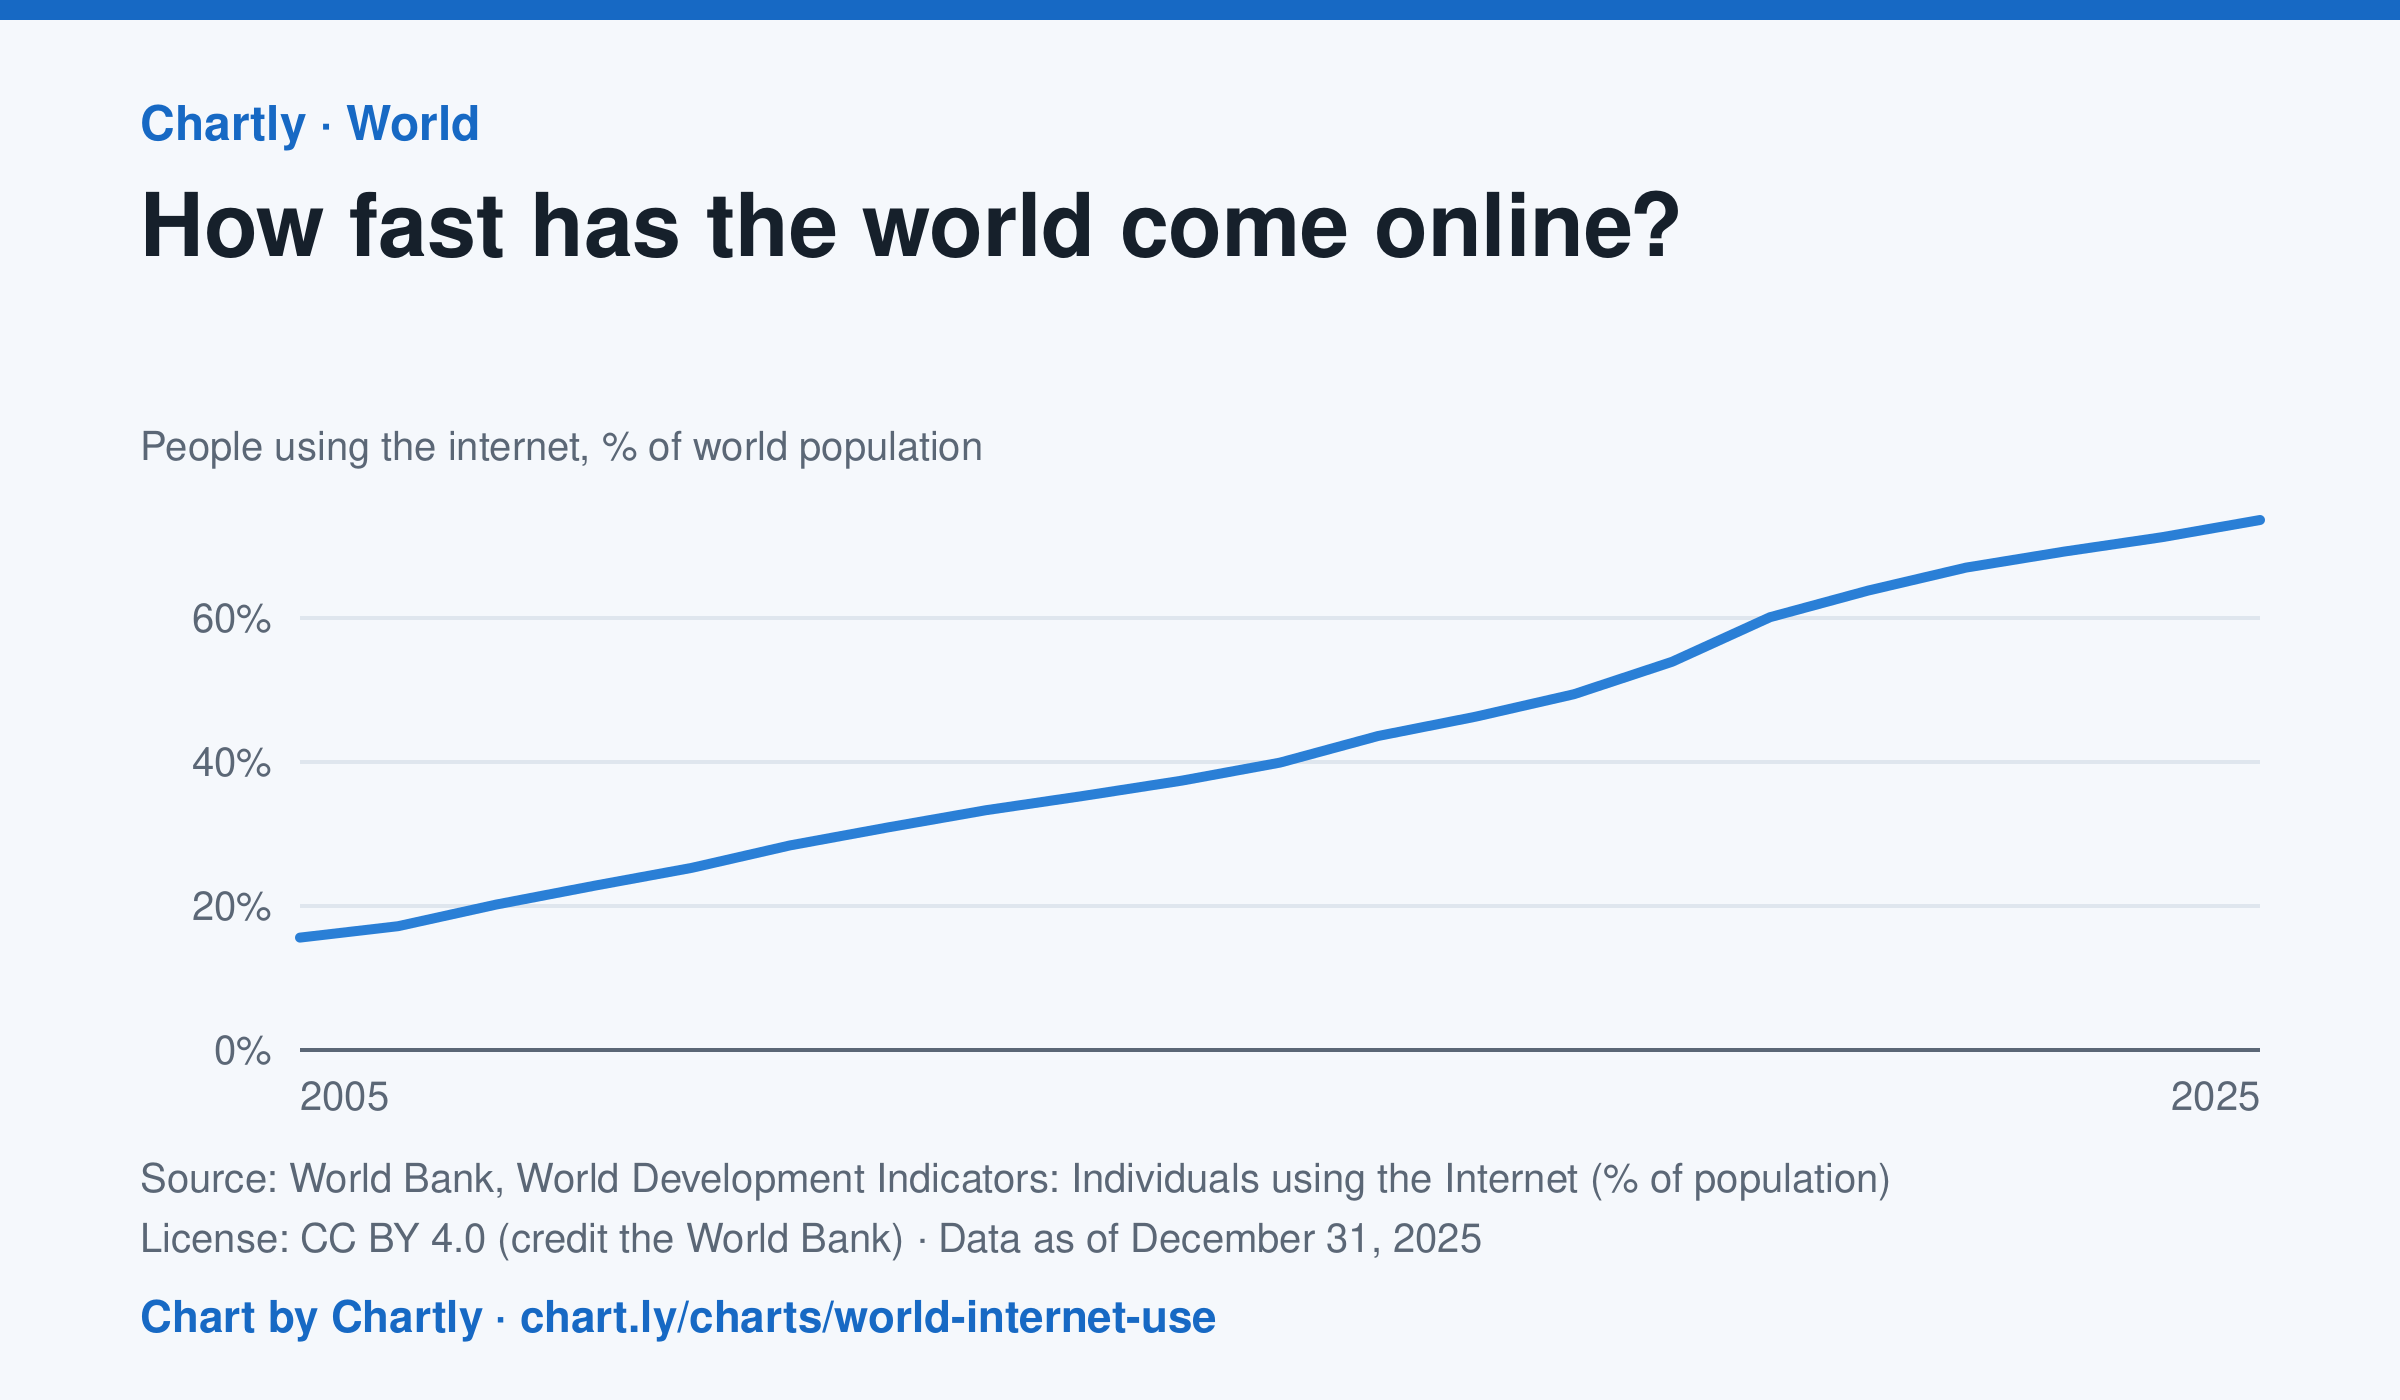
73.6% of the world's people used the internet in 2025, up from 15.6% in 2005, the first year the World Bank gives a world figure. It counts people who used the internet at least once in the previous three months. The world figures are estimates by the International Telecommunication Union.
Source: World Bank, World Development Indicators: Individuals using the Internet (% of population) (CC BY 4.0 (credit the World Bank)) · Data as of Dec 31, 2025
How to read this chart
Each point is the share of the world's people who used the internet at least once in the previous three months, as estimated by the International Telecommunication Union. The axis starts at zero, so the height shows the true share. The steeper the line, the faster people were coming online.
Questions
- About what share of the world was online in the first year on the chart, and in the latest year?
- Did the share grow faster in some years than others? What could have sped it up?
- Using the internet once in three months counts here. What does this number leave out about how people get online?
Chart and numbers: chart.ly/charts/world-internet-use · More free charts at chart.ly