Print this worksheet, or choose "Save as PDF" in the print window to share a file.
Chart worksheet
Charts to read and discuss
Name:
Class:
Date:
Chart 1 of 3 · World
How has the world's population grown since 1960?
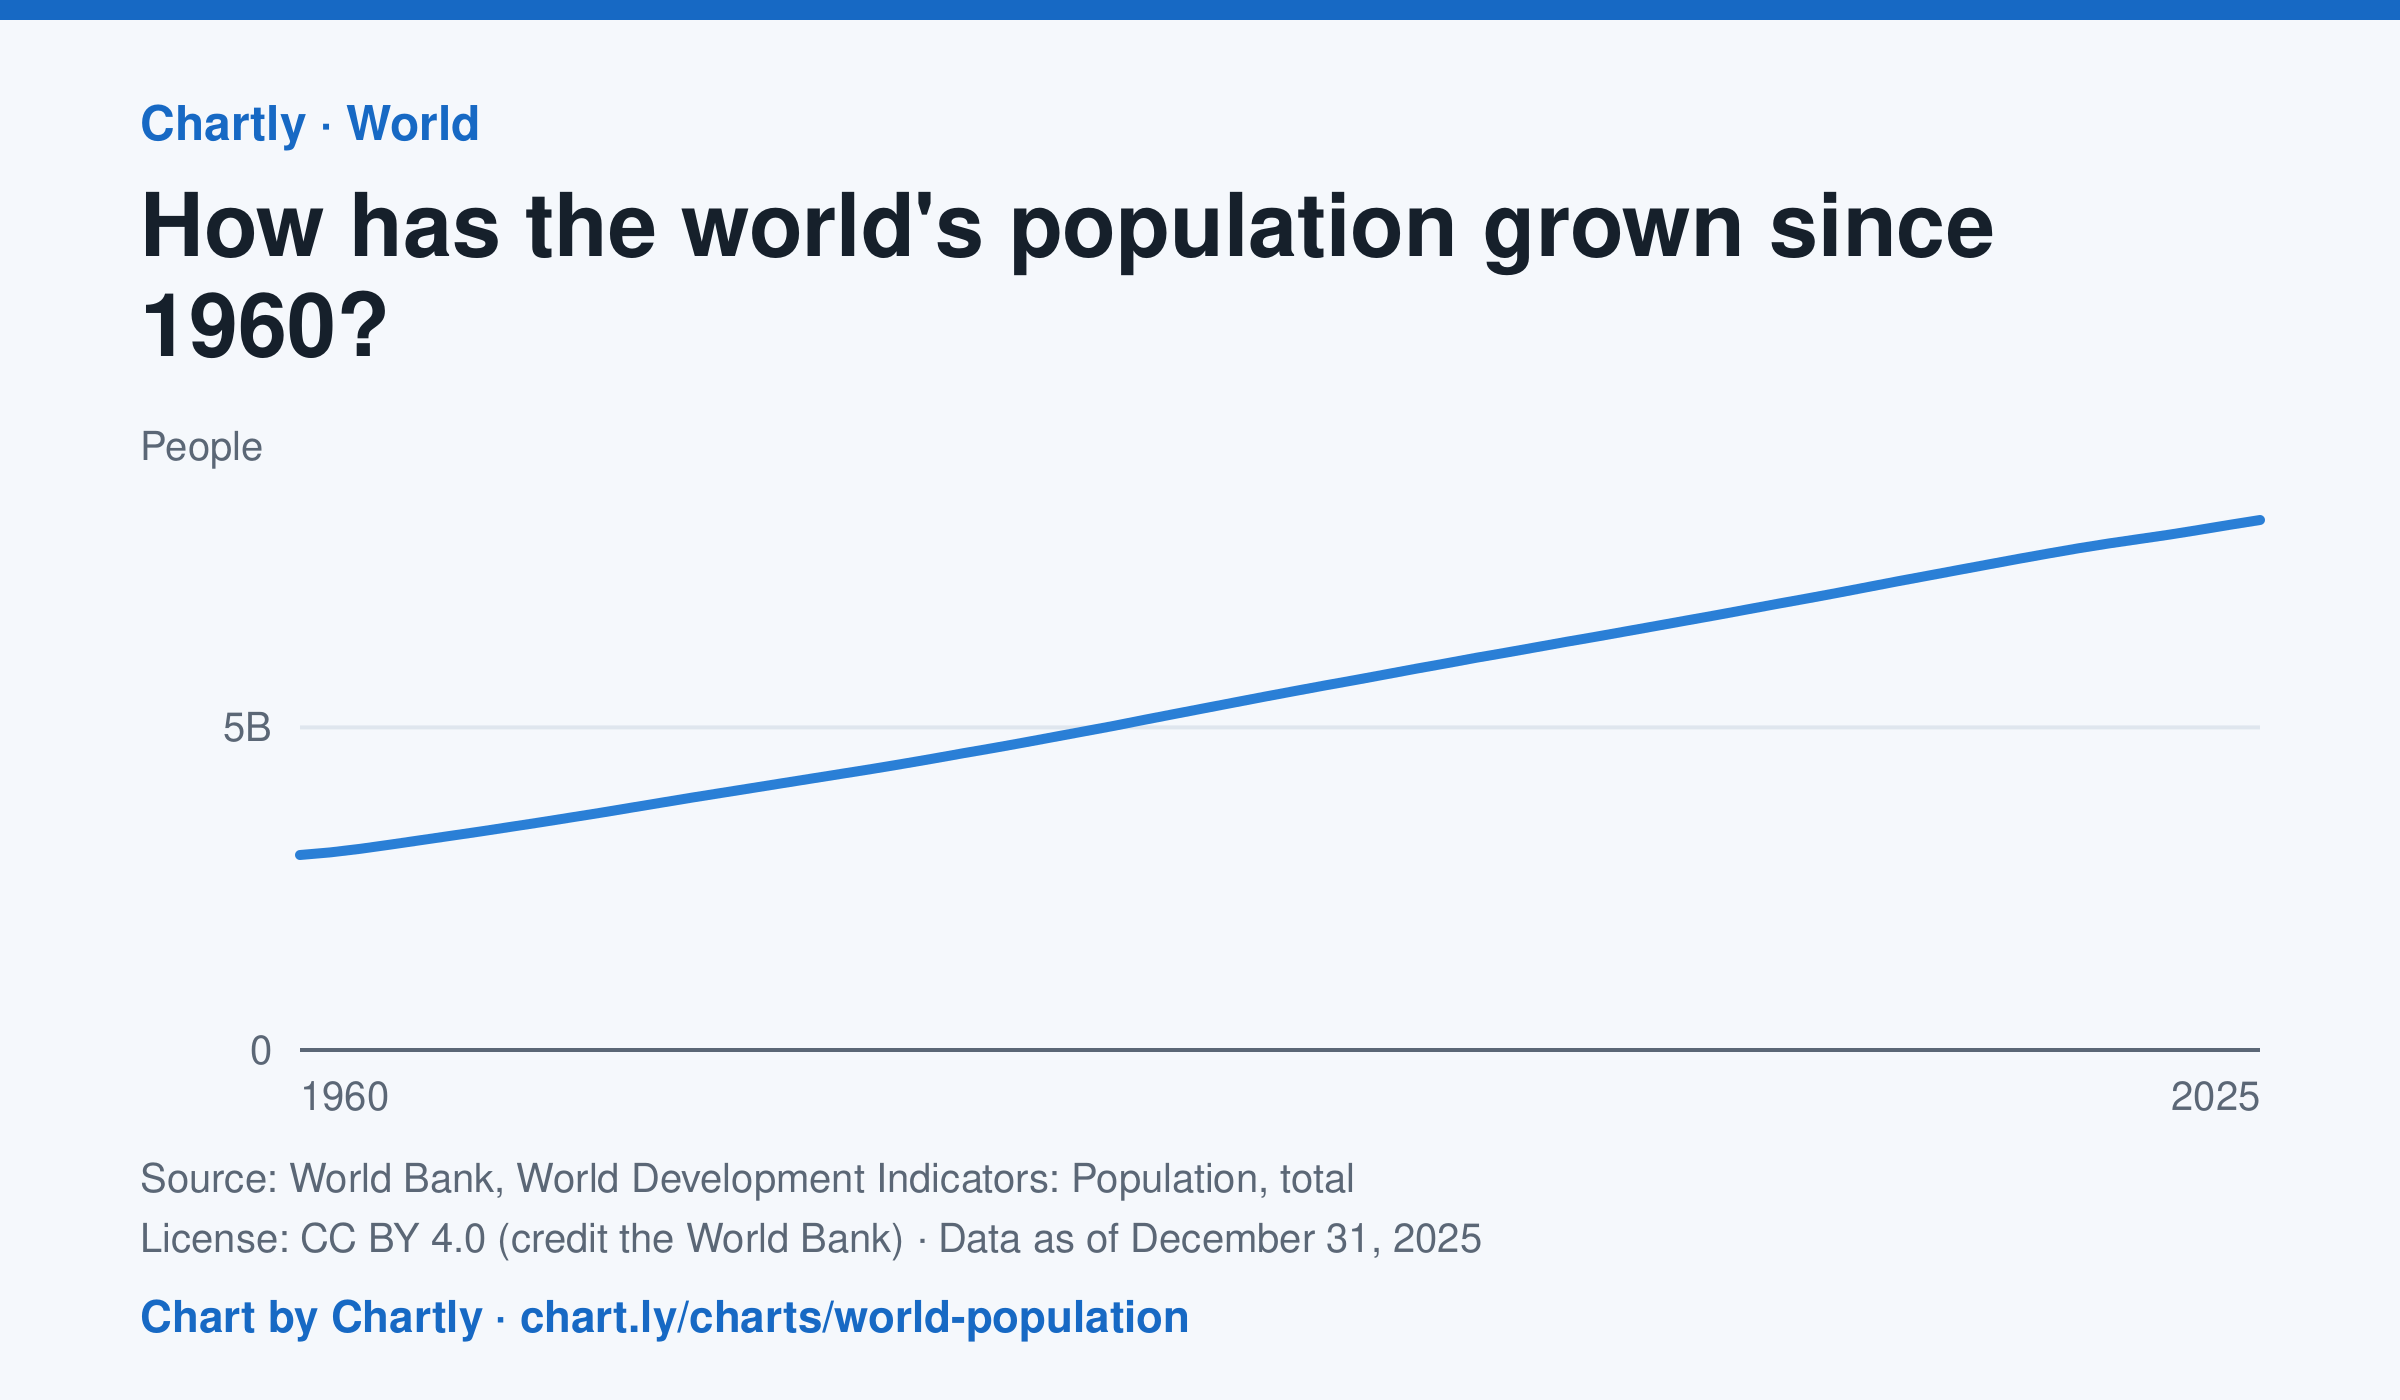
The world had 8.22 billion people in 2025, about 2.7 times the 3.02 billion of 1960. It passed 8 billion in 2023. Figures are mid-year estimates from the United Nations, which revises them as new censuses come in.
Source: World Bank, World Development Indicators: Population, total (CC BY 4.0 (credit the World Bank)) · Data as of Dec 31, 2025
How to read this chart
Each point is the number of people alive in the world in the middle of that year, estimated by the United Nations. The axis starts at zero, so the height of the line shows the true size. Look at how steep the line is to see how fast the population grew.
Questions
- Judging from the chart, about how many years did it take the world to add its most recent billion people?
- Is the line getting steeper or flatter in recent years? What does that tell you about the growth rate?
- These numbers are estimates that the UN revises. Why is it hard to count every person on Earth?
Chart and numbers: chart.ly/charts/world-population · More free charts at chart.ly
Chart 2 of 3 · Inflation
How fast are US prices rising?
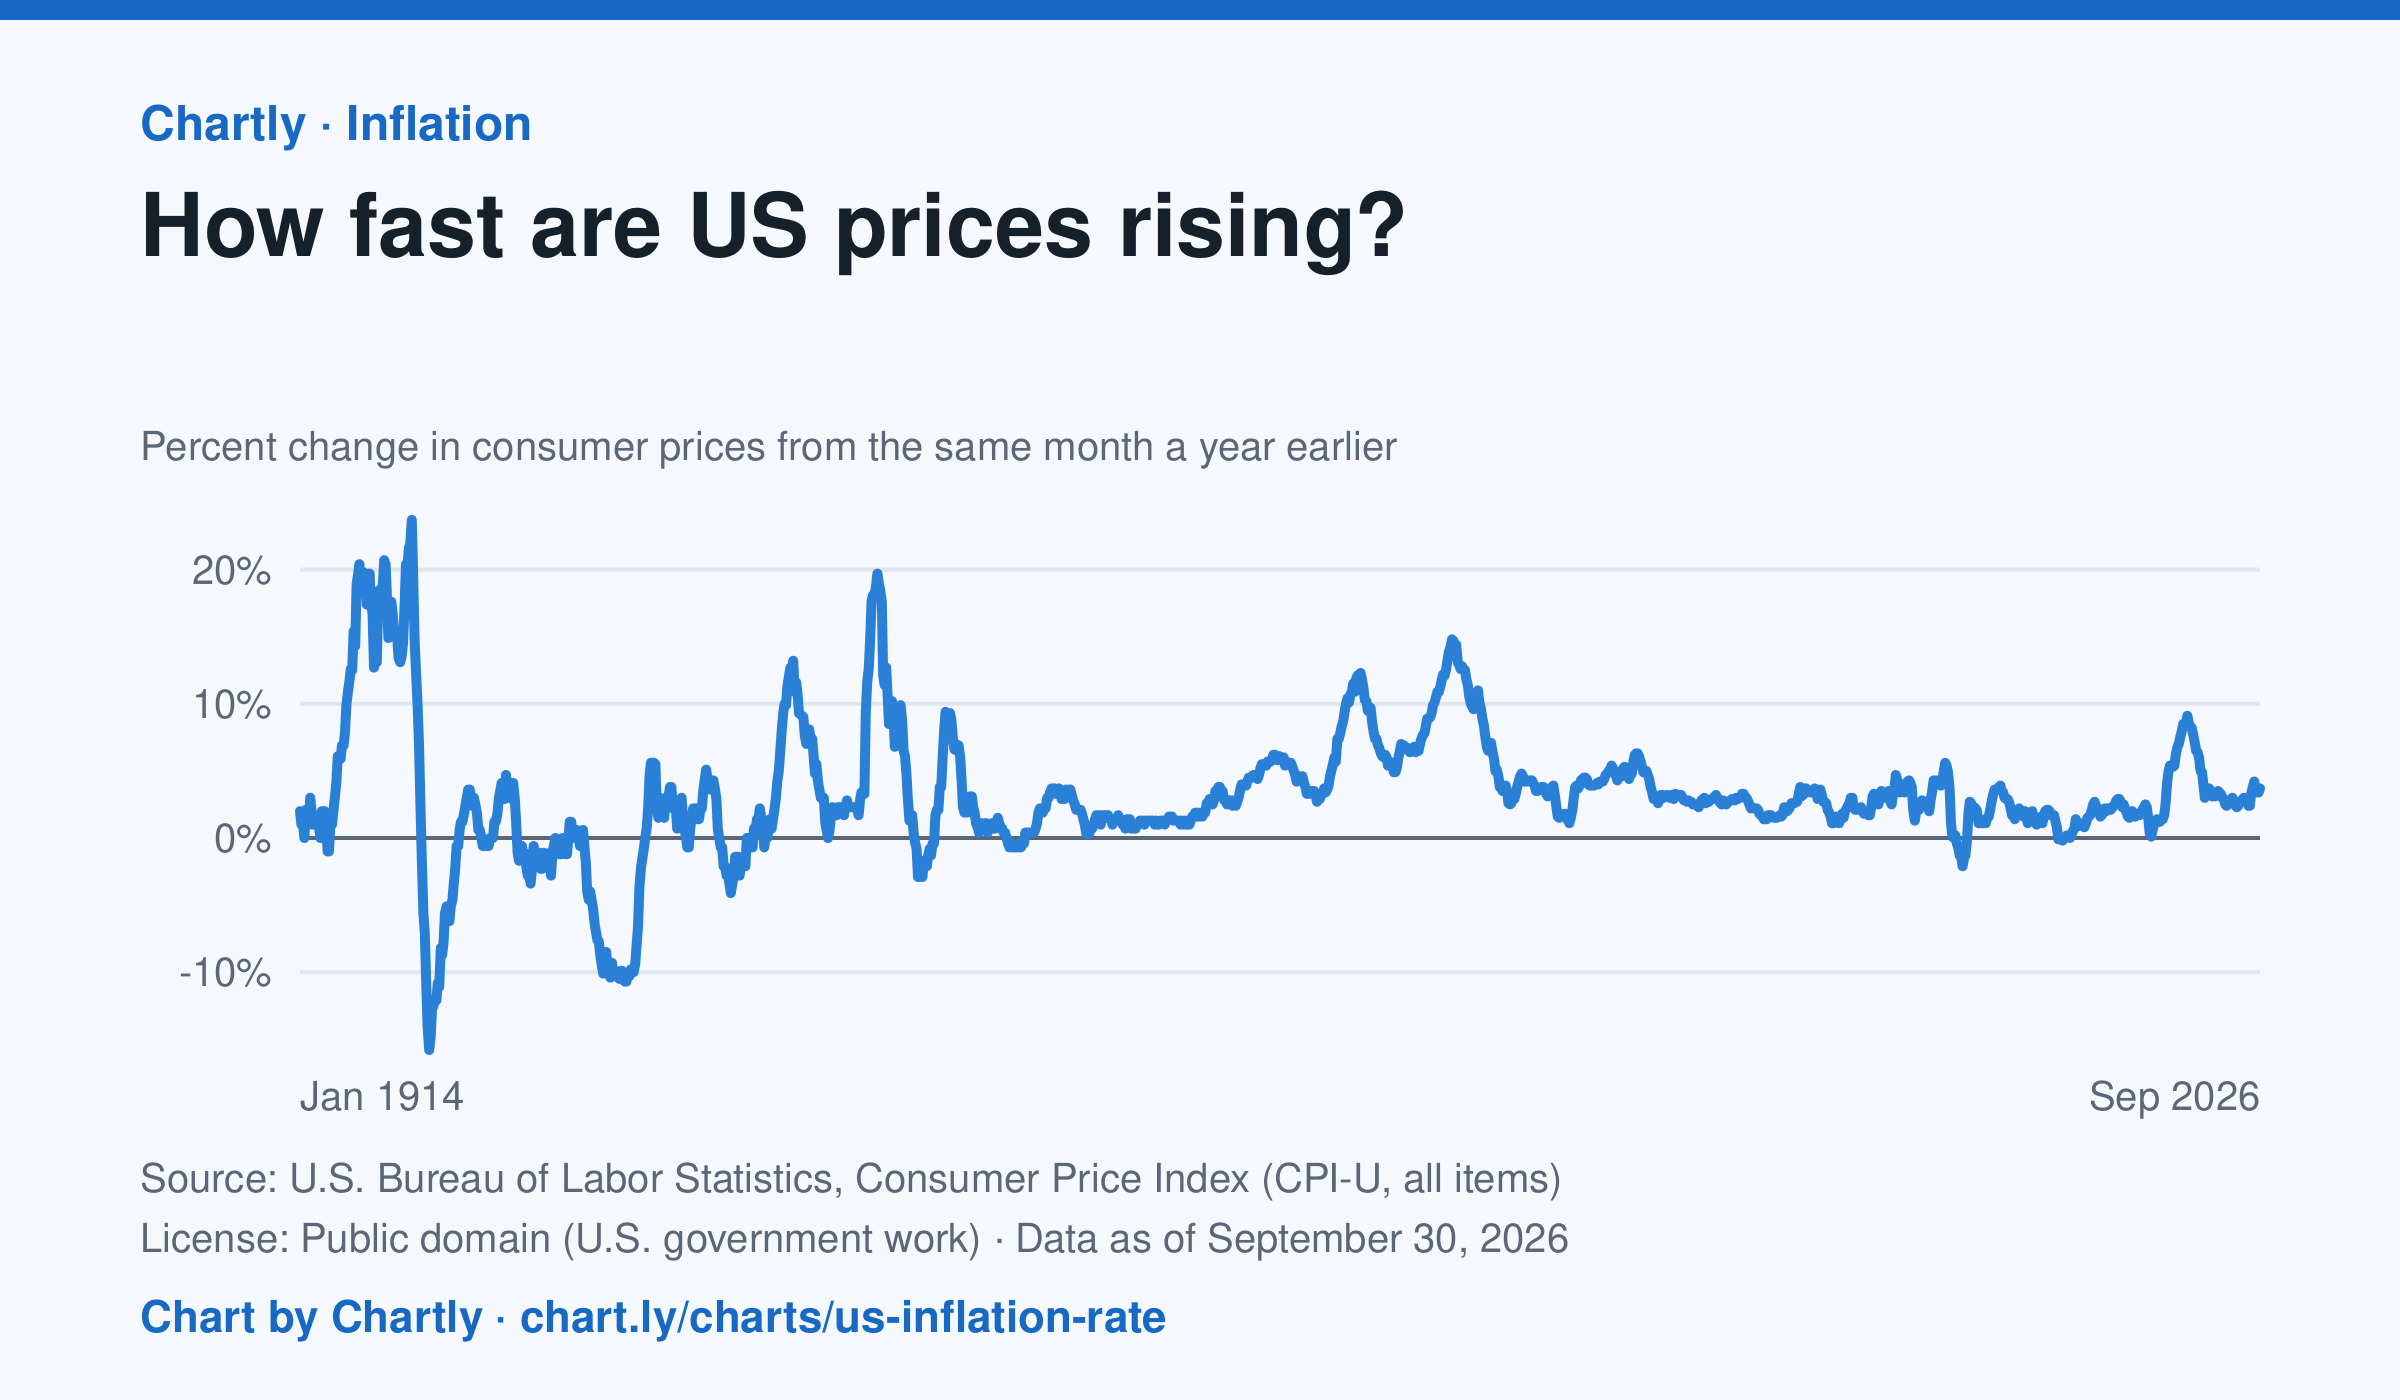
The inflation rate was 3.7% in September 2026: how much consumer prices changed from the same month a year earlier. Each point makes that comparison, back to 1914, the first year BLS can compare. Inflation peaked at 23.7% in June 1920 and at 14.8% in March 1980; the 9.1% of June 2022 was the highest since 1981. Prices fell as fast as 15.8% a year in 1921 and 10.7% in 1932. BLS collected no prices in October 2025, during a lapse in federal funding, so that month and October 2026 are missing.
Source: U.S. Bureau of Labor Statistics, Consumer Price Index (CPI-U, all items) (Public domain (U.S. government work)) · Data as of Sep 30, 2026
How to read this chart
Each point compares consumer prices in a month with the same month a year earlier. A value of 3 means things cost about 3% more than a year before; below zero means prices fell. The chart shows how fast prices change, not how high they are.
Questions
- Find two times when inflation was highest. What was happening in the country then?
- If inflation falls from 8% to 3%, are prices going down, or just rising more slowly?
- Find a stretch when the line is below zero. Why might falling prices be bad news for workers and businesses?
Chart and numbers: chart.ly/charts/us-inflation-rate · More free charts at chart.ly
Chart 3 of 3 · Space
How many planets outside our solar system are discovered each year?
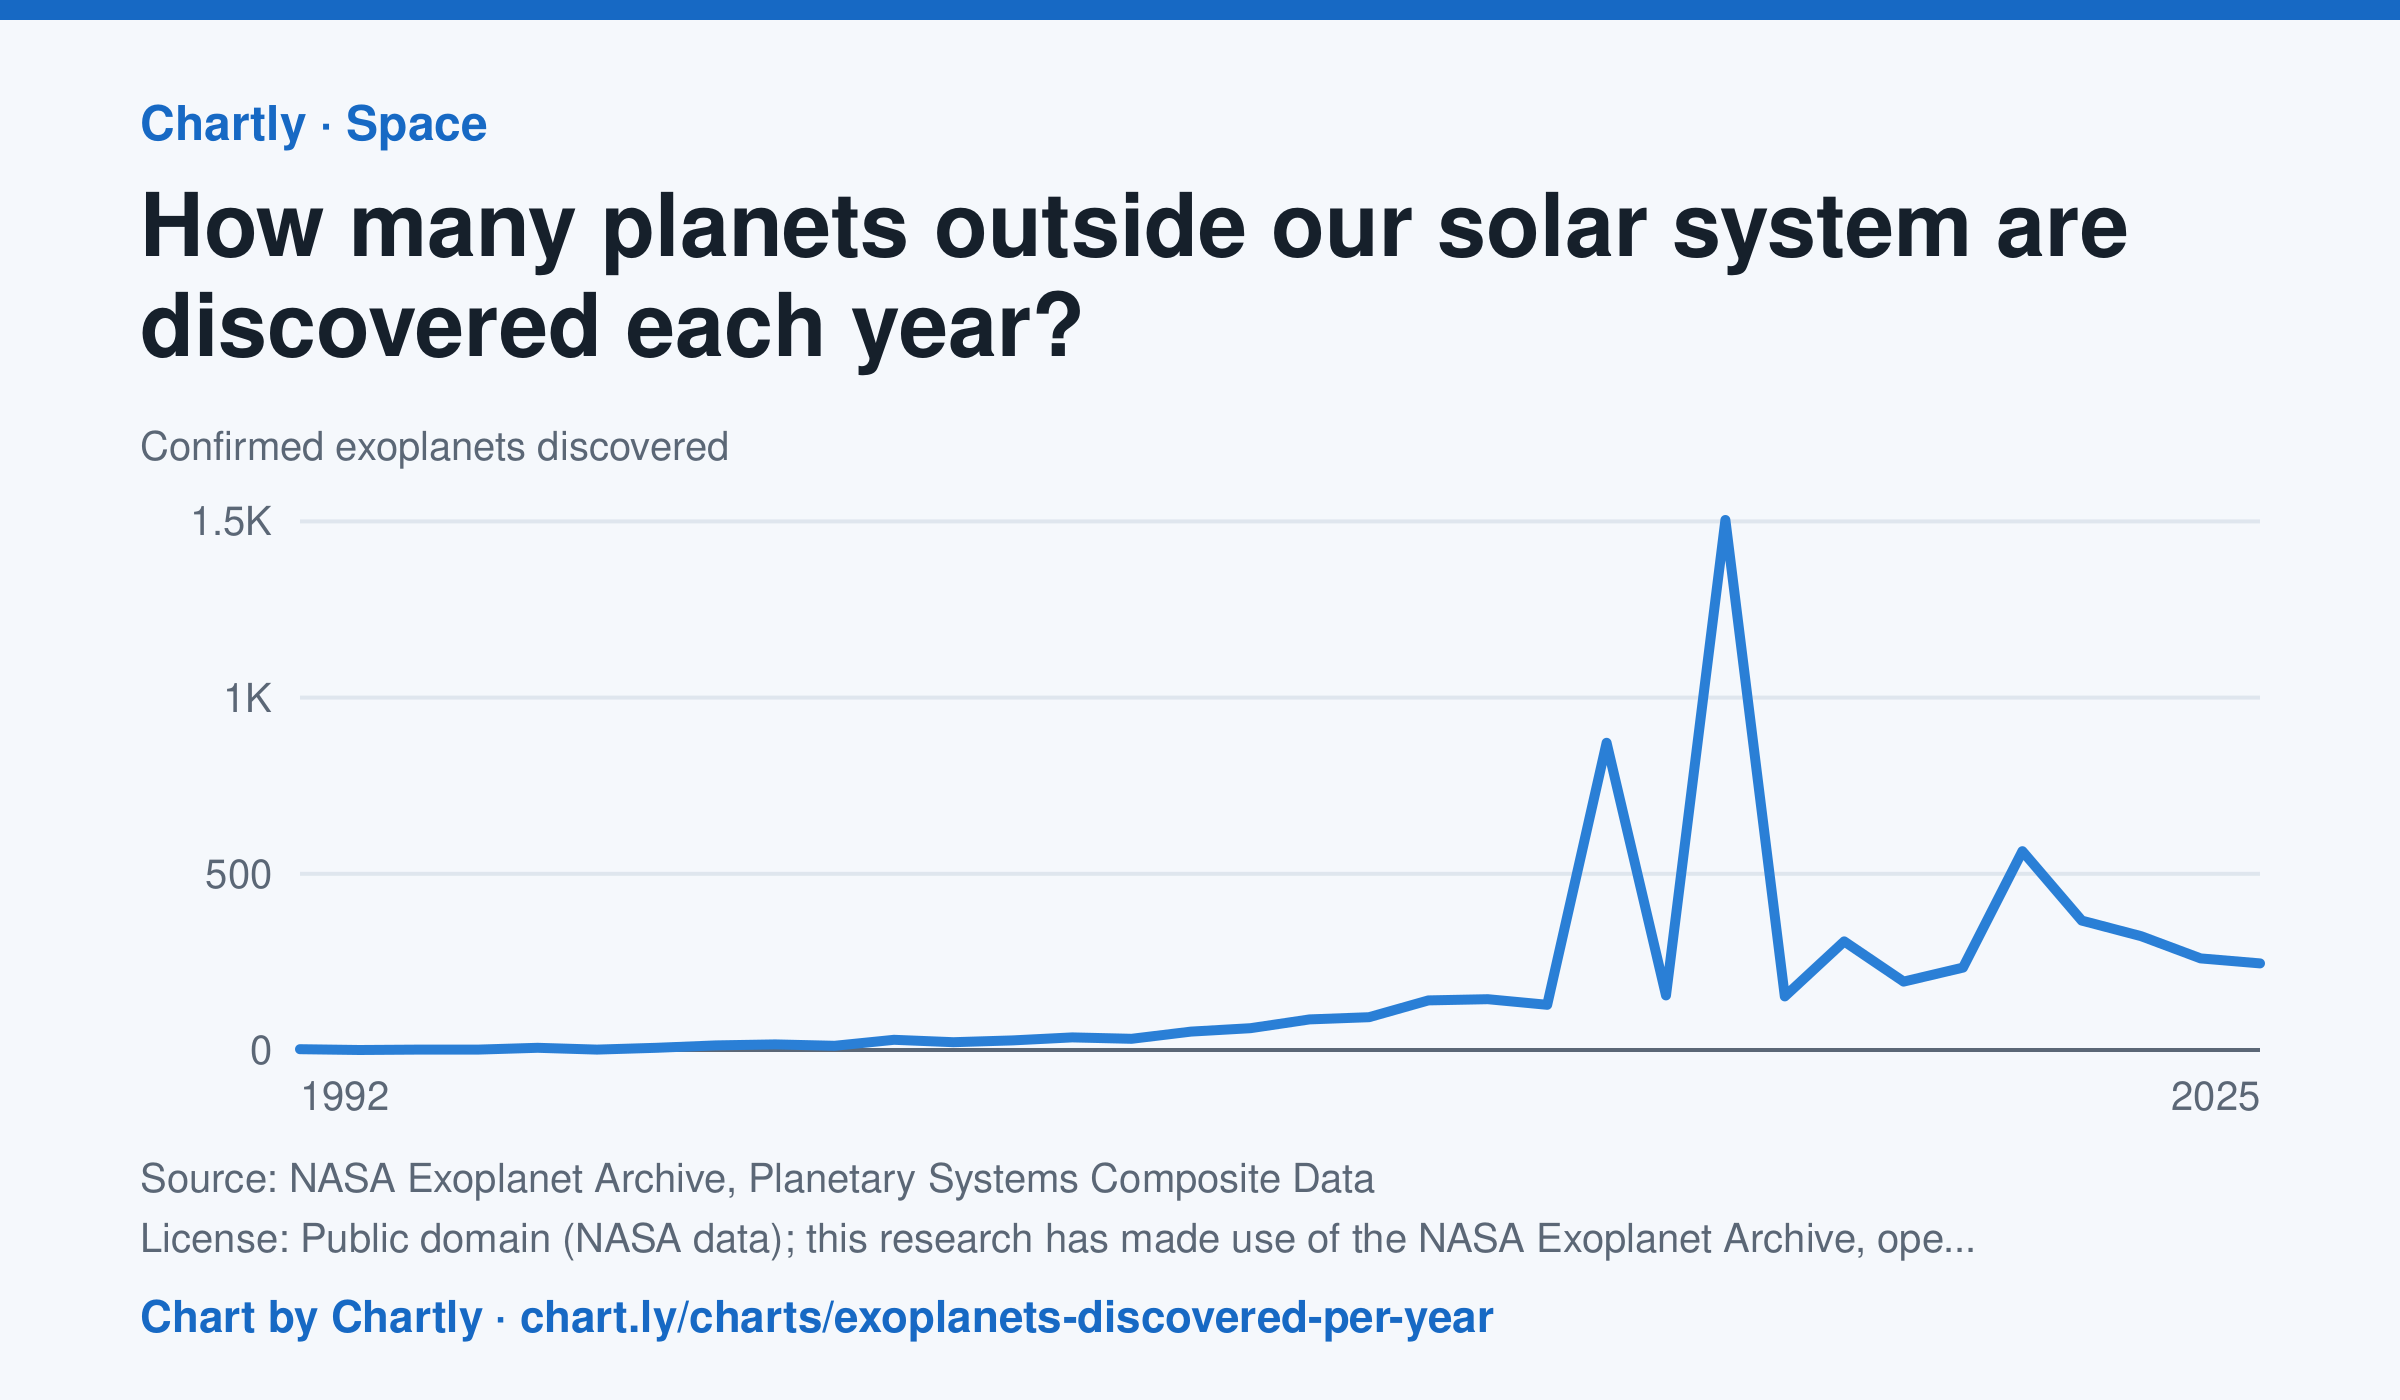
Astronomers confirmed 245 new planets around other stars in 2025. The first were found in 1992, and the count leaped in 2014 and 2016 (872 and 1,504), when NASA's Kepler team confirmed hundreds of its candidates at once. The archive counts a planet in the year its discovery was published and keeps adding late confirmations, so recent years can still rise.
Source: NASA Exoplanet Archive, Planetary Systems Composite Data (Public domain (NASA data); this research has made use of the NASA Exoplanet Archive, operated by Caltech under contract with NASA) · Data as of Dec 31, 2025
How to read this chart
Each point is how many planets around other stars, called exoplanets, astronomers confirmed in a year. The count depends on telescopes as much as on the sky: a new space telescope can confirm hundreds at once. The numbers come from NASA's Exoplanet Archive.
Questions
- Find the two biggest jumps on the chart. What could cause so many planets to be confirmed in one year?
- How many planets were confirmed in the first year on the chart, and how many in the newest year?
- Does a big year on this chart mean there were more planets in space that year? What does it really measure?
Chart and numbers: chart.ly/charts/exoplanets-discovered-per-year · More free charts at chart.ly