Print this worksheet, or choose "Save as PDF" in the print window to share a file.
Chart worksheet
Charts to read and discuss
Name:
Class:
Date:
Chart 1 of 2 · World
How has the world's population grown since 1960?
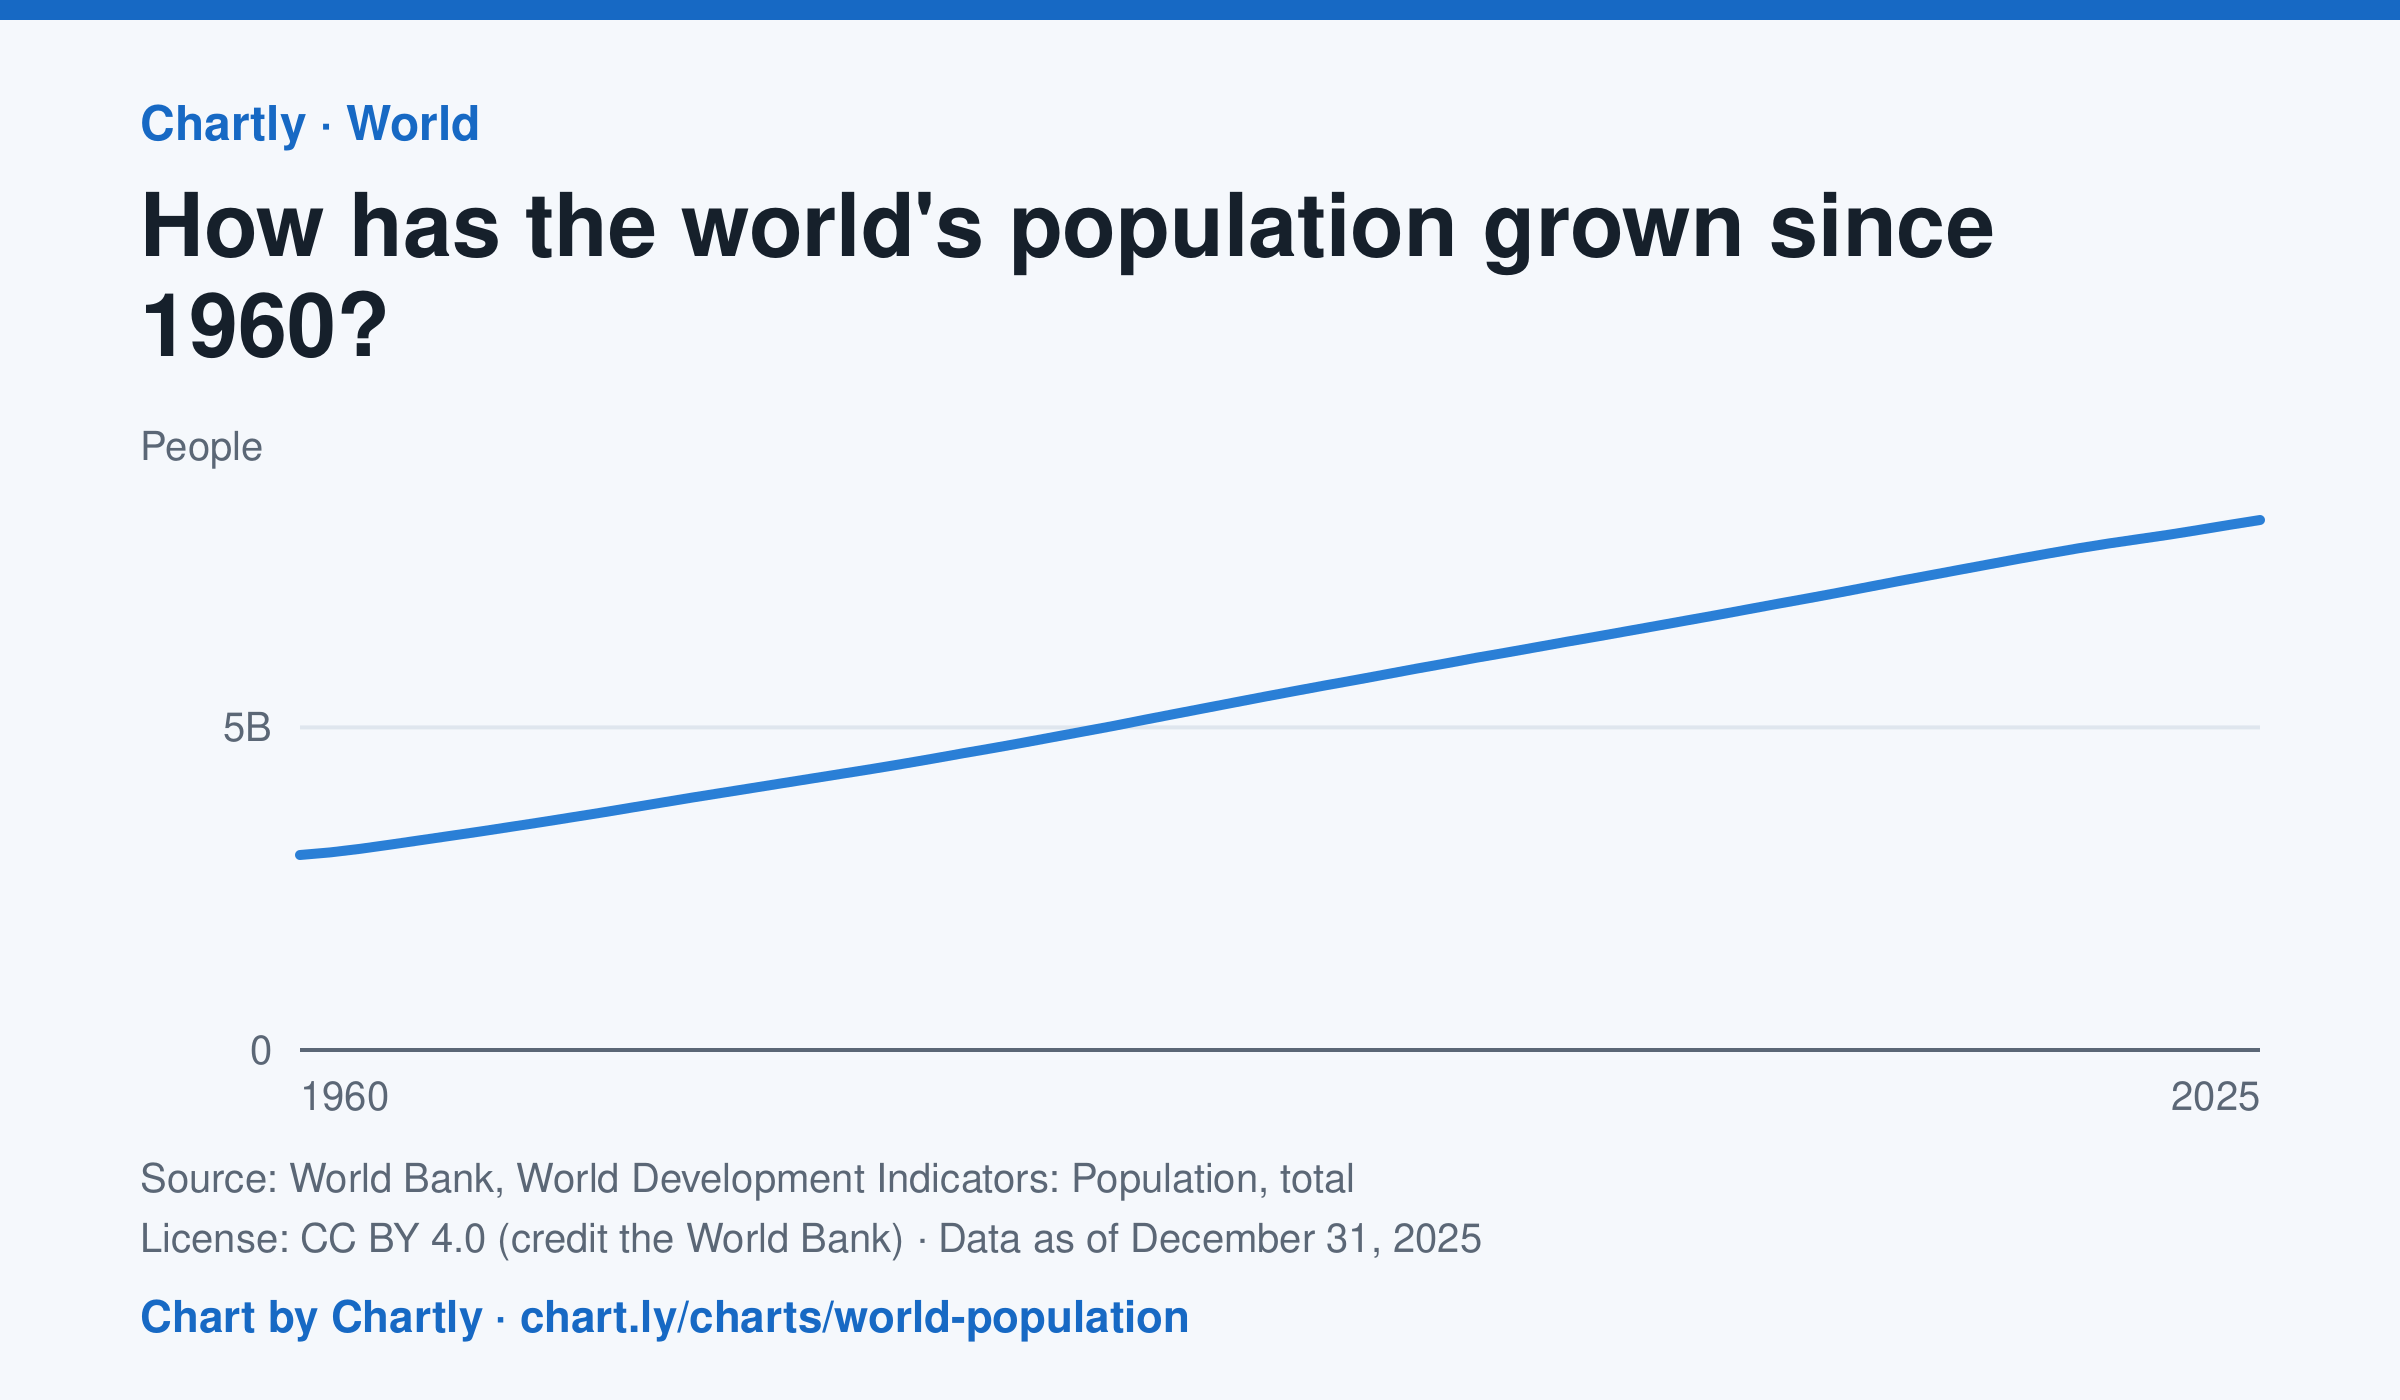
The world had 8.22 billion people in 2025, about 2.7 times the 3.02 billion of 1960. It passed 8 billion in 2023. Figures are mid-year estimates from the United Nations, which revises them as new censuses come in.
Source: World Bank, World Development Indicators: Population, total (CC BY 4.0 (credit the World Bank)) · Data as of Dec 31, 2025
How to read this chart
Each point is the number of people alive in the world in the middle of that year, estimated by the United Nations. The axis starts at zero, so the height of the line shows the true size. Look at how steep the line is to see how fast the population grew.
Questions
- Judging from the chart, about how many years did it take the world to add its most recent billion people?
- Is the line getting steeper or flatter in recent years? What does that tell you about the growth rate?
- These numbers are estimates that the UN revises. Why is it hard to count every person on Earth?
Chart and numbers: chart.ly/charts/world-population · More free charts at chart.ly
Chart 2 of 2 · NFL
How often are NFL field goals good from each distance?
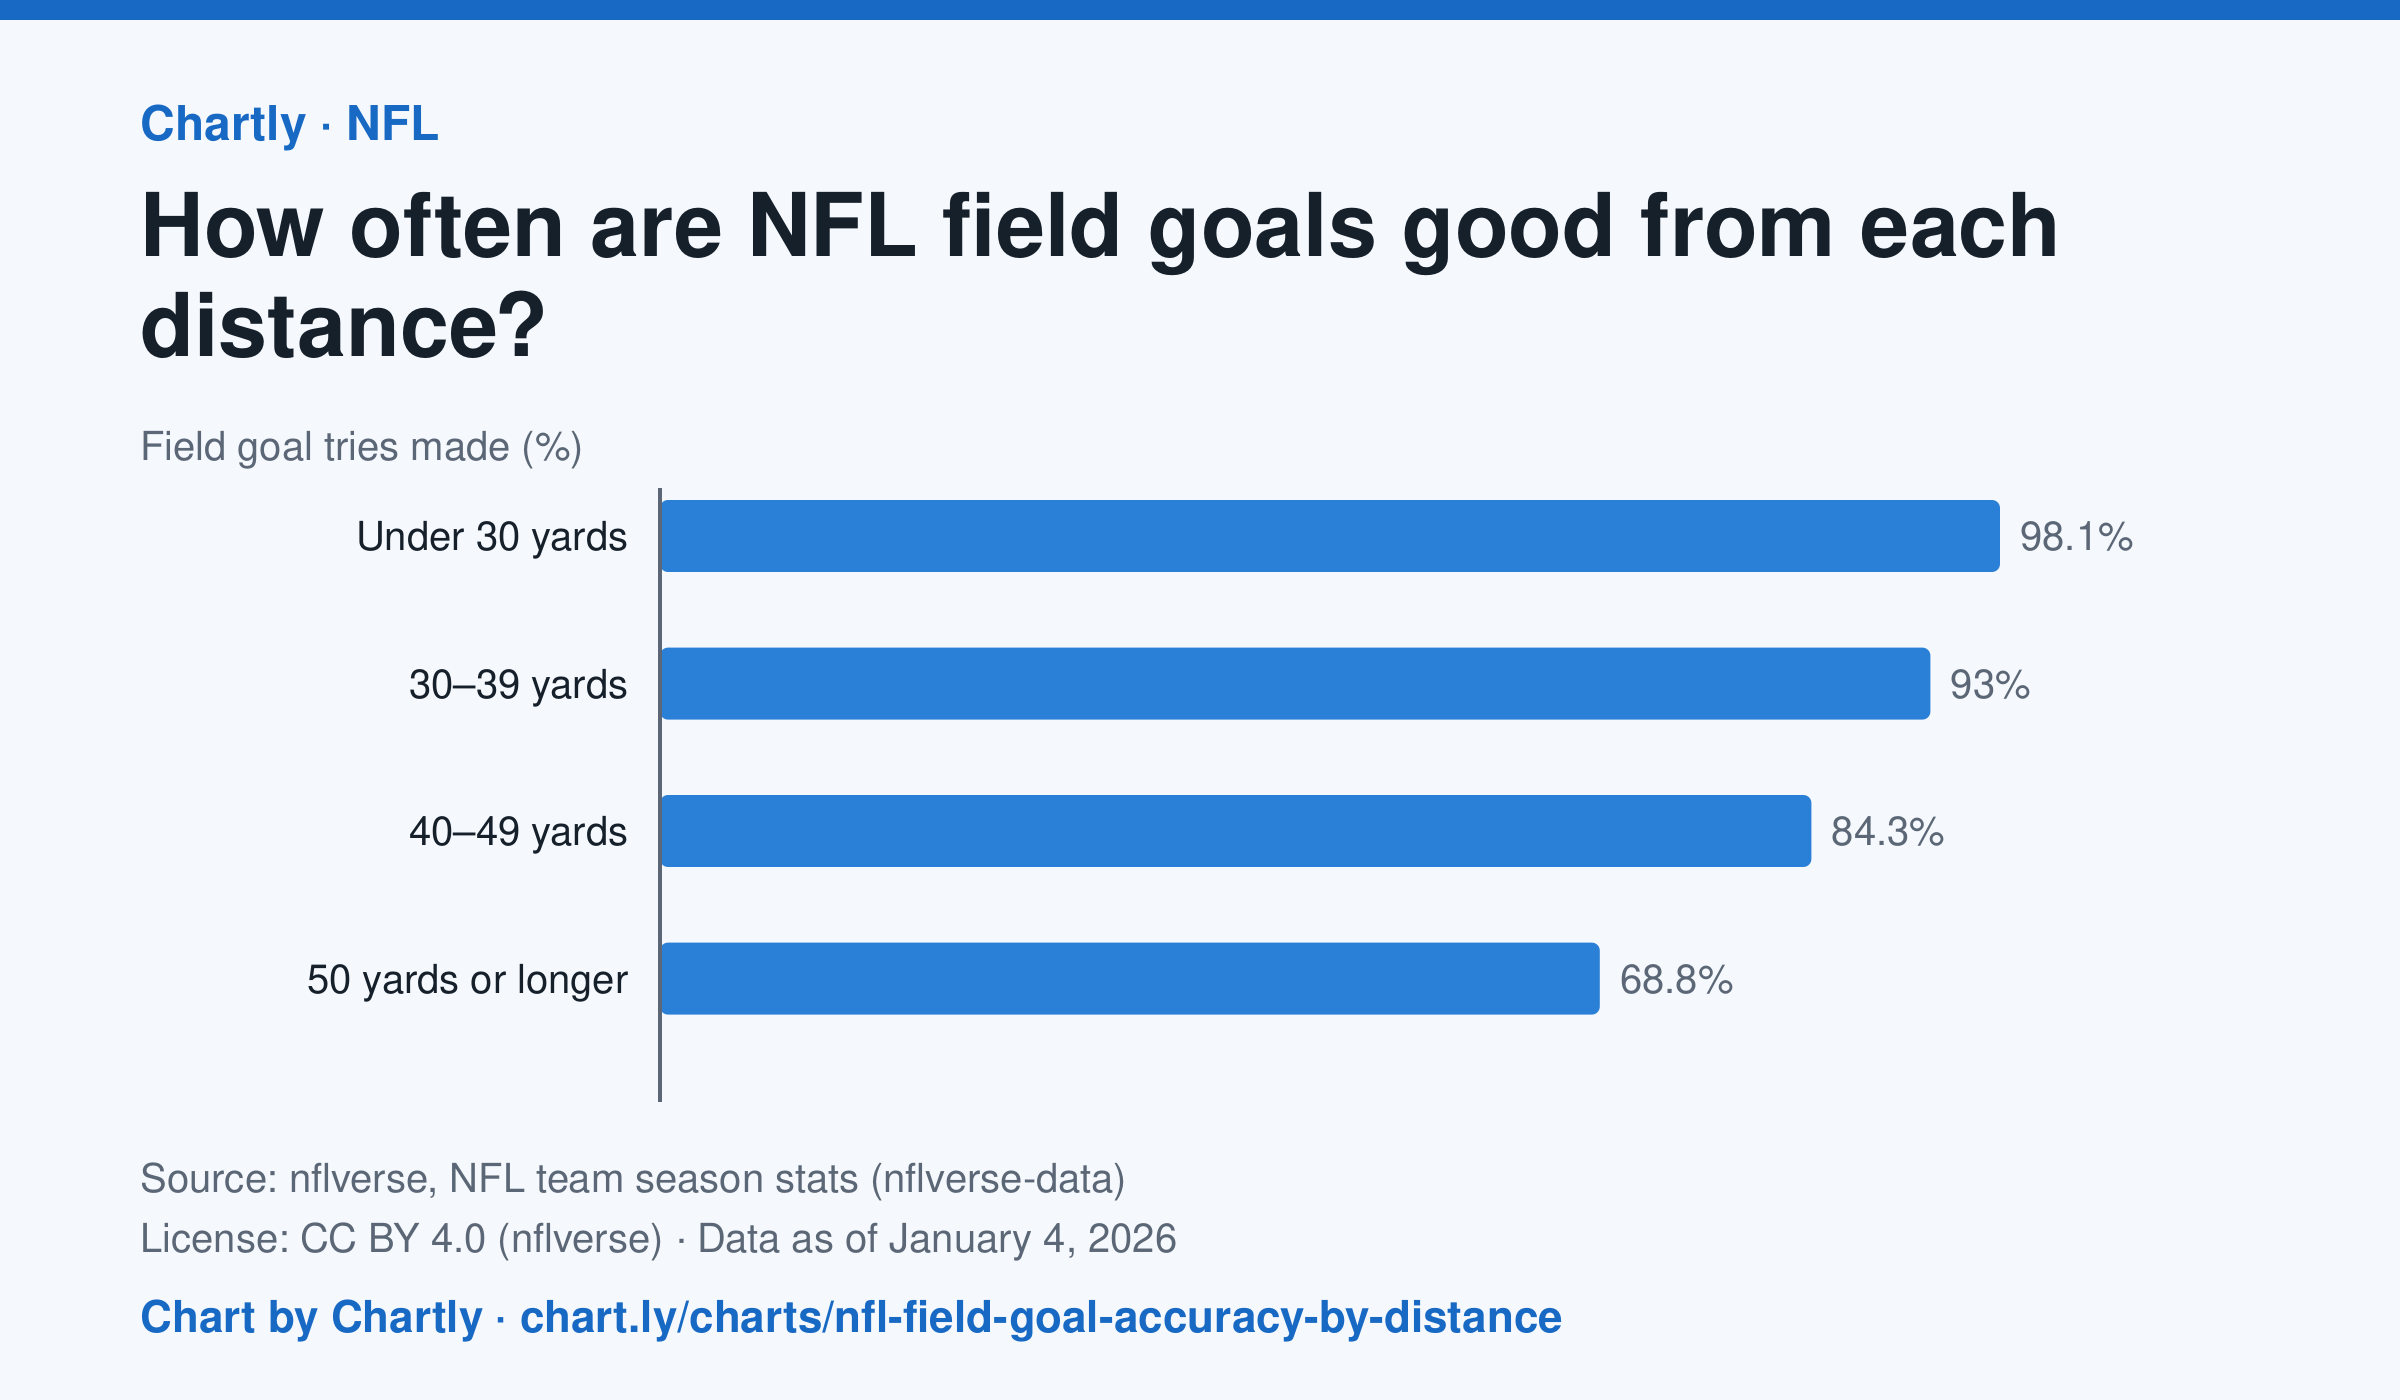
In the NFL regular season that ended in January 2026, kickers made 98.1% of field goal tries from under 30 yards, 84.3% from 40 to 49 yards and 68.8% from 50 yards or longer. Blocked kicks count as misses.
Source: nflverse, NFL team season stats (nflverse-data) (CC BY 4.0 (nflverse)) · Data as of Jan 4, 2026
How to read this chart
Each bar is the percent of field goal tries NFL kickers made from one range of distances in the latest regular season. A percent of tries made is a probability: 90% means about 9 of every 10 kicks were good. The bars start at zero, so compare their lengths.
Questions
- From which distance are field goals made most often, and from which least often?
- If a kicker tries 10 kicks from 50 yards or longer, about how many would you expect to be good?
- A coach can kick a long field goal or go for it on fourth down. What else would you need to know to choose?
Chart and numbers: chart.ly/charts/nfl-field-goal-accuracy-by-distance · More free charts at chart.ly