Print this worksheet, or choose "Save as PDF" in the print window to share a file.
Chart worksheet
Charts to read and discuss
Name:
Class:
Date:
Chart 1 of 3 · World
How has the world's population grown since 1960?
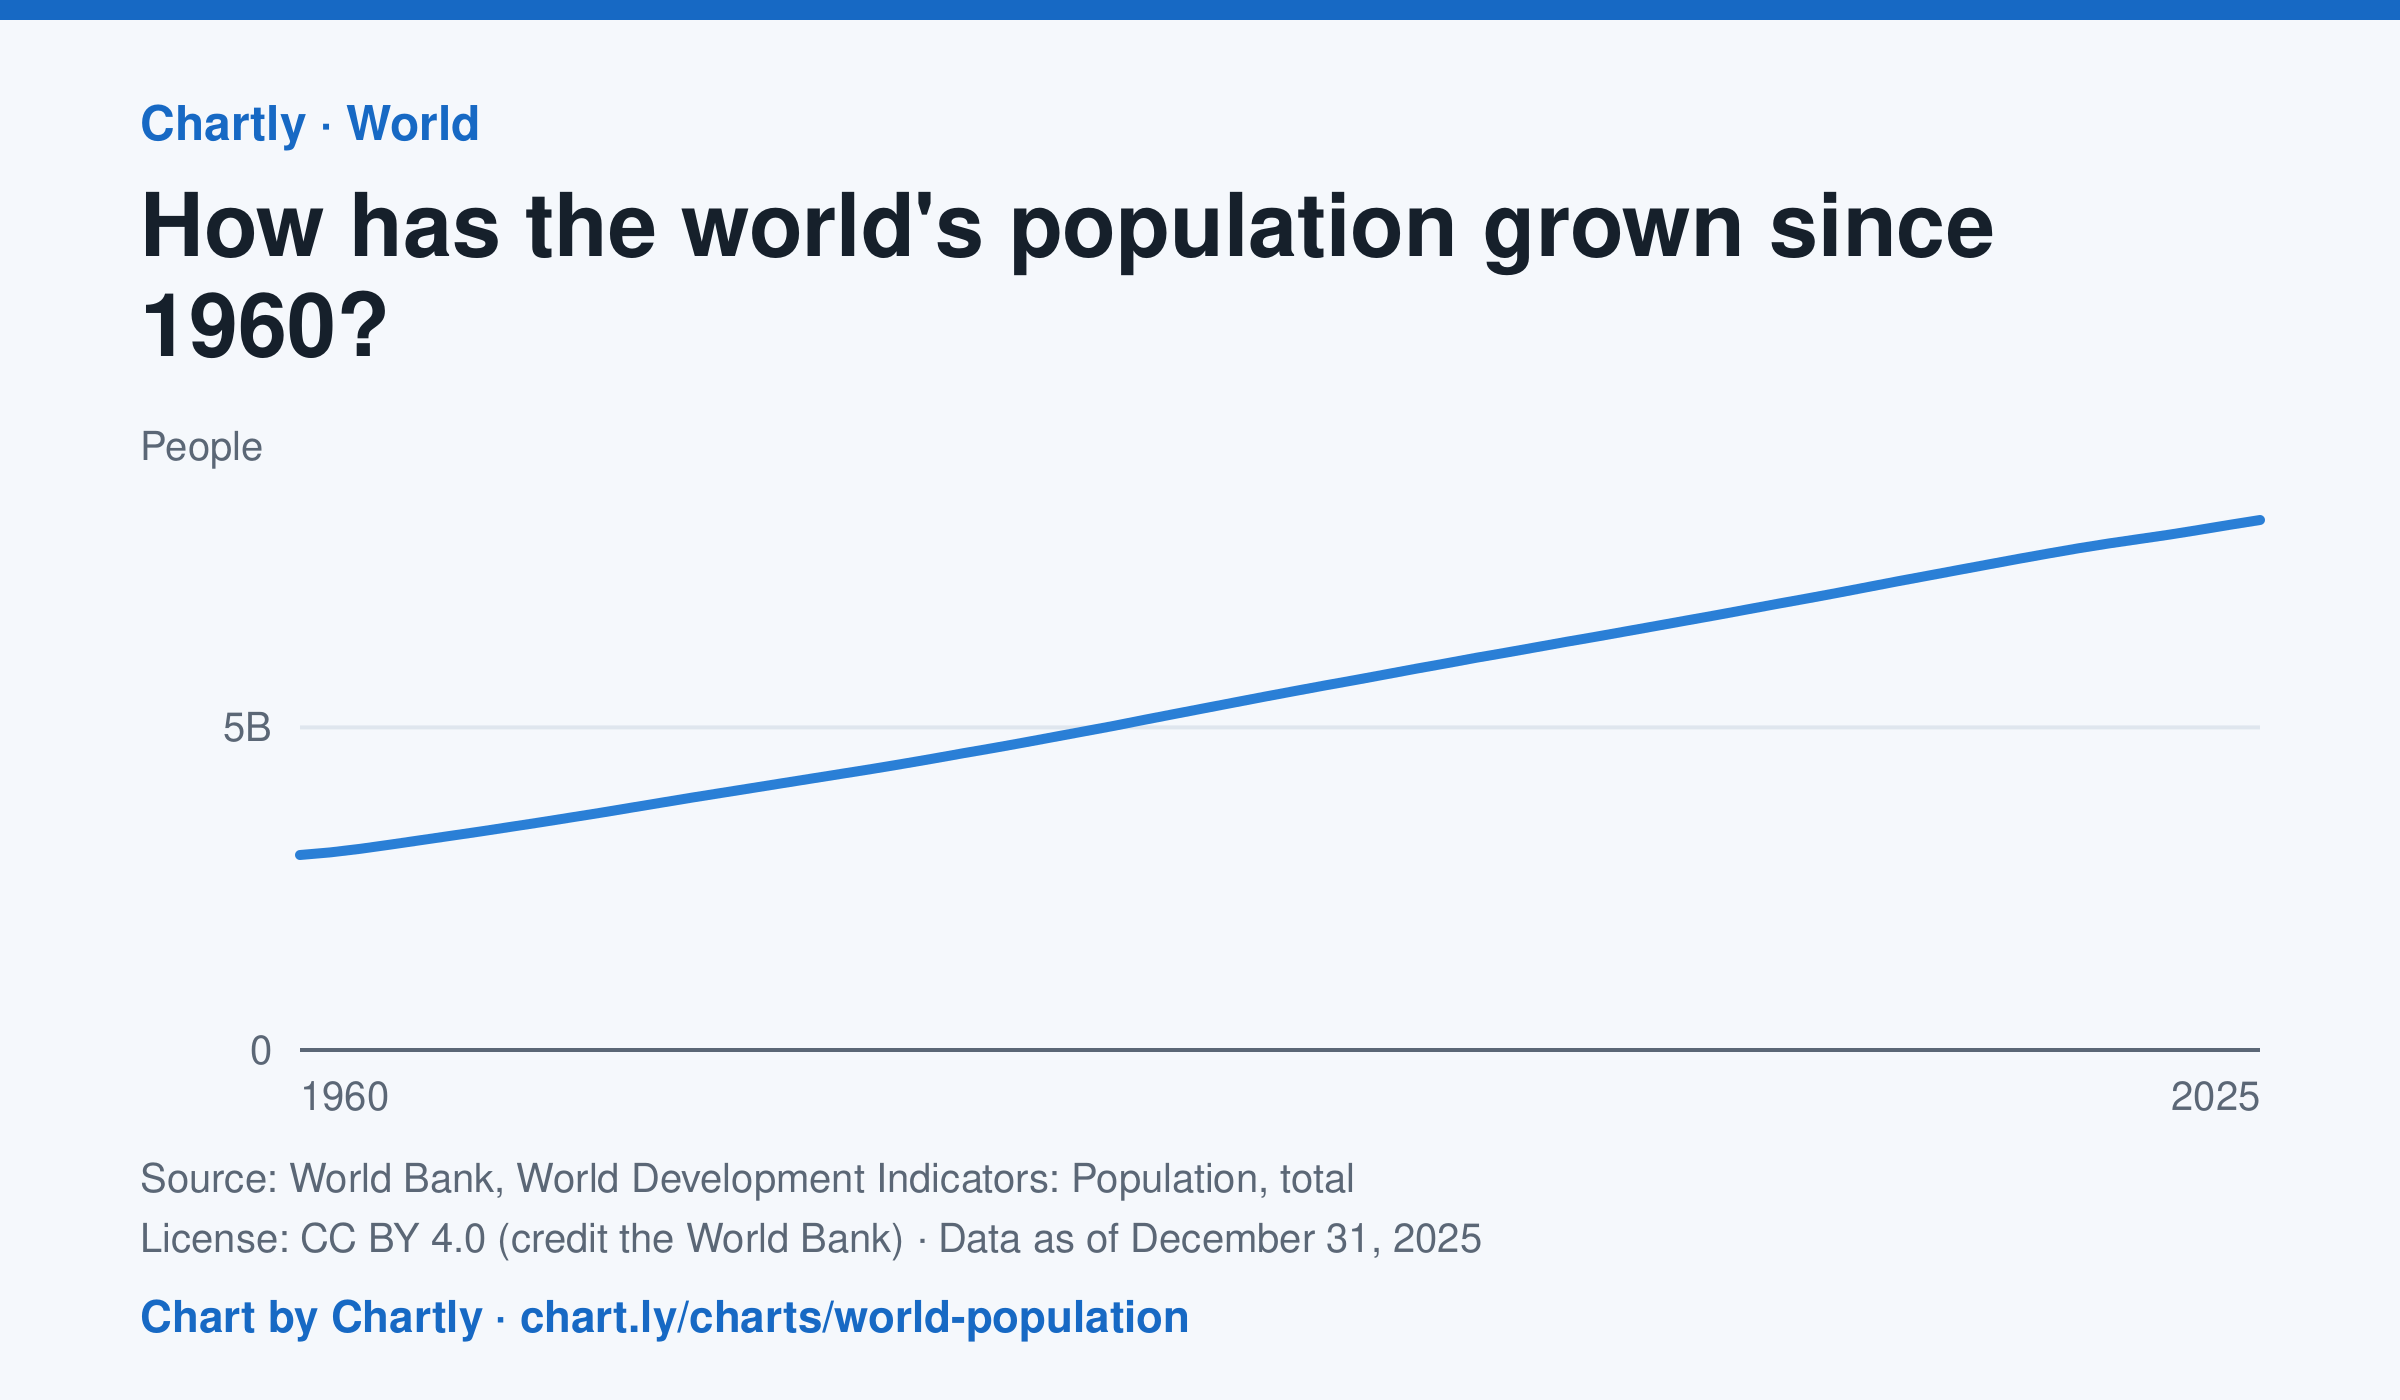
The world had 8.22 billion people in 2025, about 2.7 times the 3.02 billion of 1960. It passed 8 billion in 2023. Figures are mid-year estimates from the United Nations, which revises them as new censuses come in.
Source: World Bank, World Development Indicators: Population, total (CC BY 4.0 (credit the World Bank)) · Data as of Dec 31, 2025
How to read this chart
Each point is the number of people alive in the world in the middle of that year, estimated by the United Nations. The axis starts at zero, so the height of the line shows the true size. Look at how steep the line is to see how fast the population grew.
Questions
- Judging from the chart, about how many years did it take the world to add its most recent billion people?
- Is the line getting steeper or flatter in recent years? What does that tell you about the growth rate?
- These numbers are estimates that the UN revises. Why is it hard to count every person on Earth?
Chart and numbers: chart.ly/charts/world-population · More free charts at chart.ly
Chart 2 of 3 · Housing
How much is rent in each state?
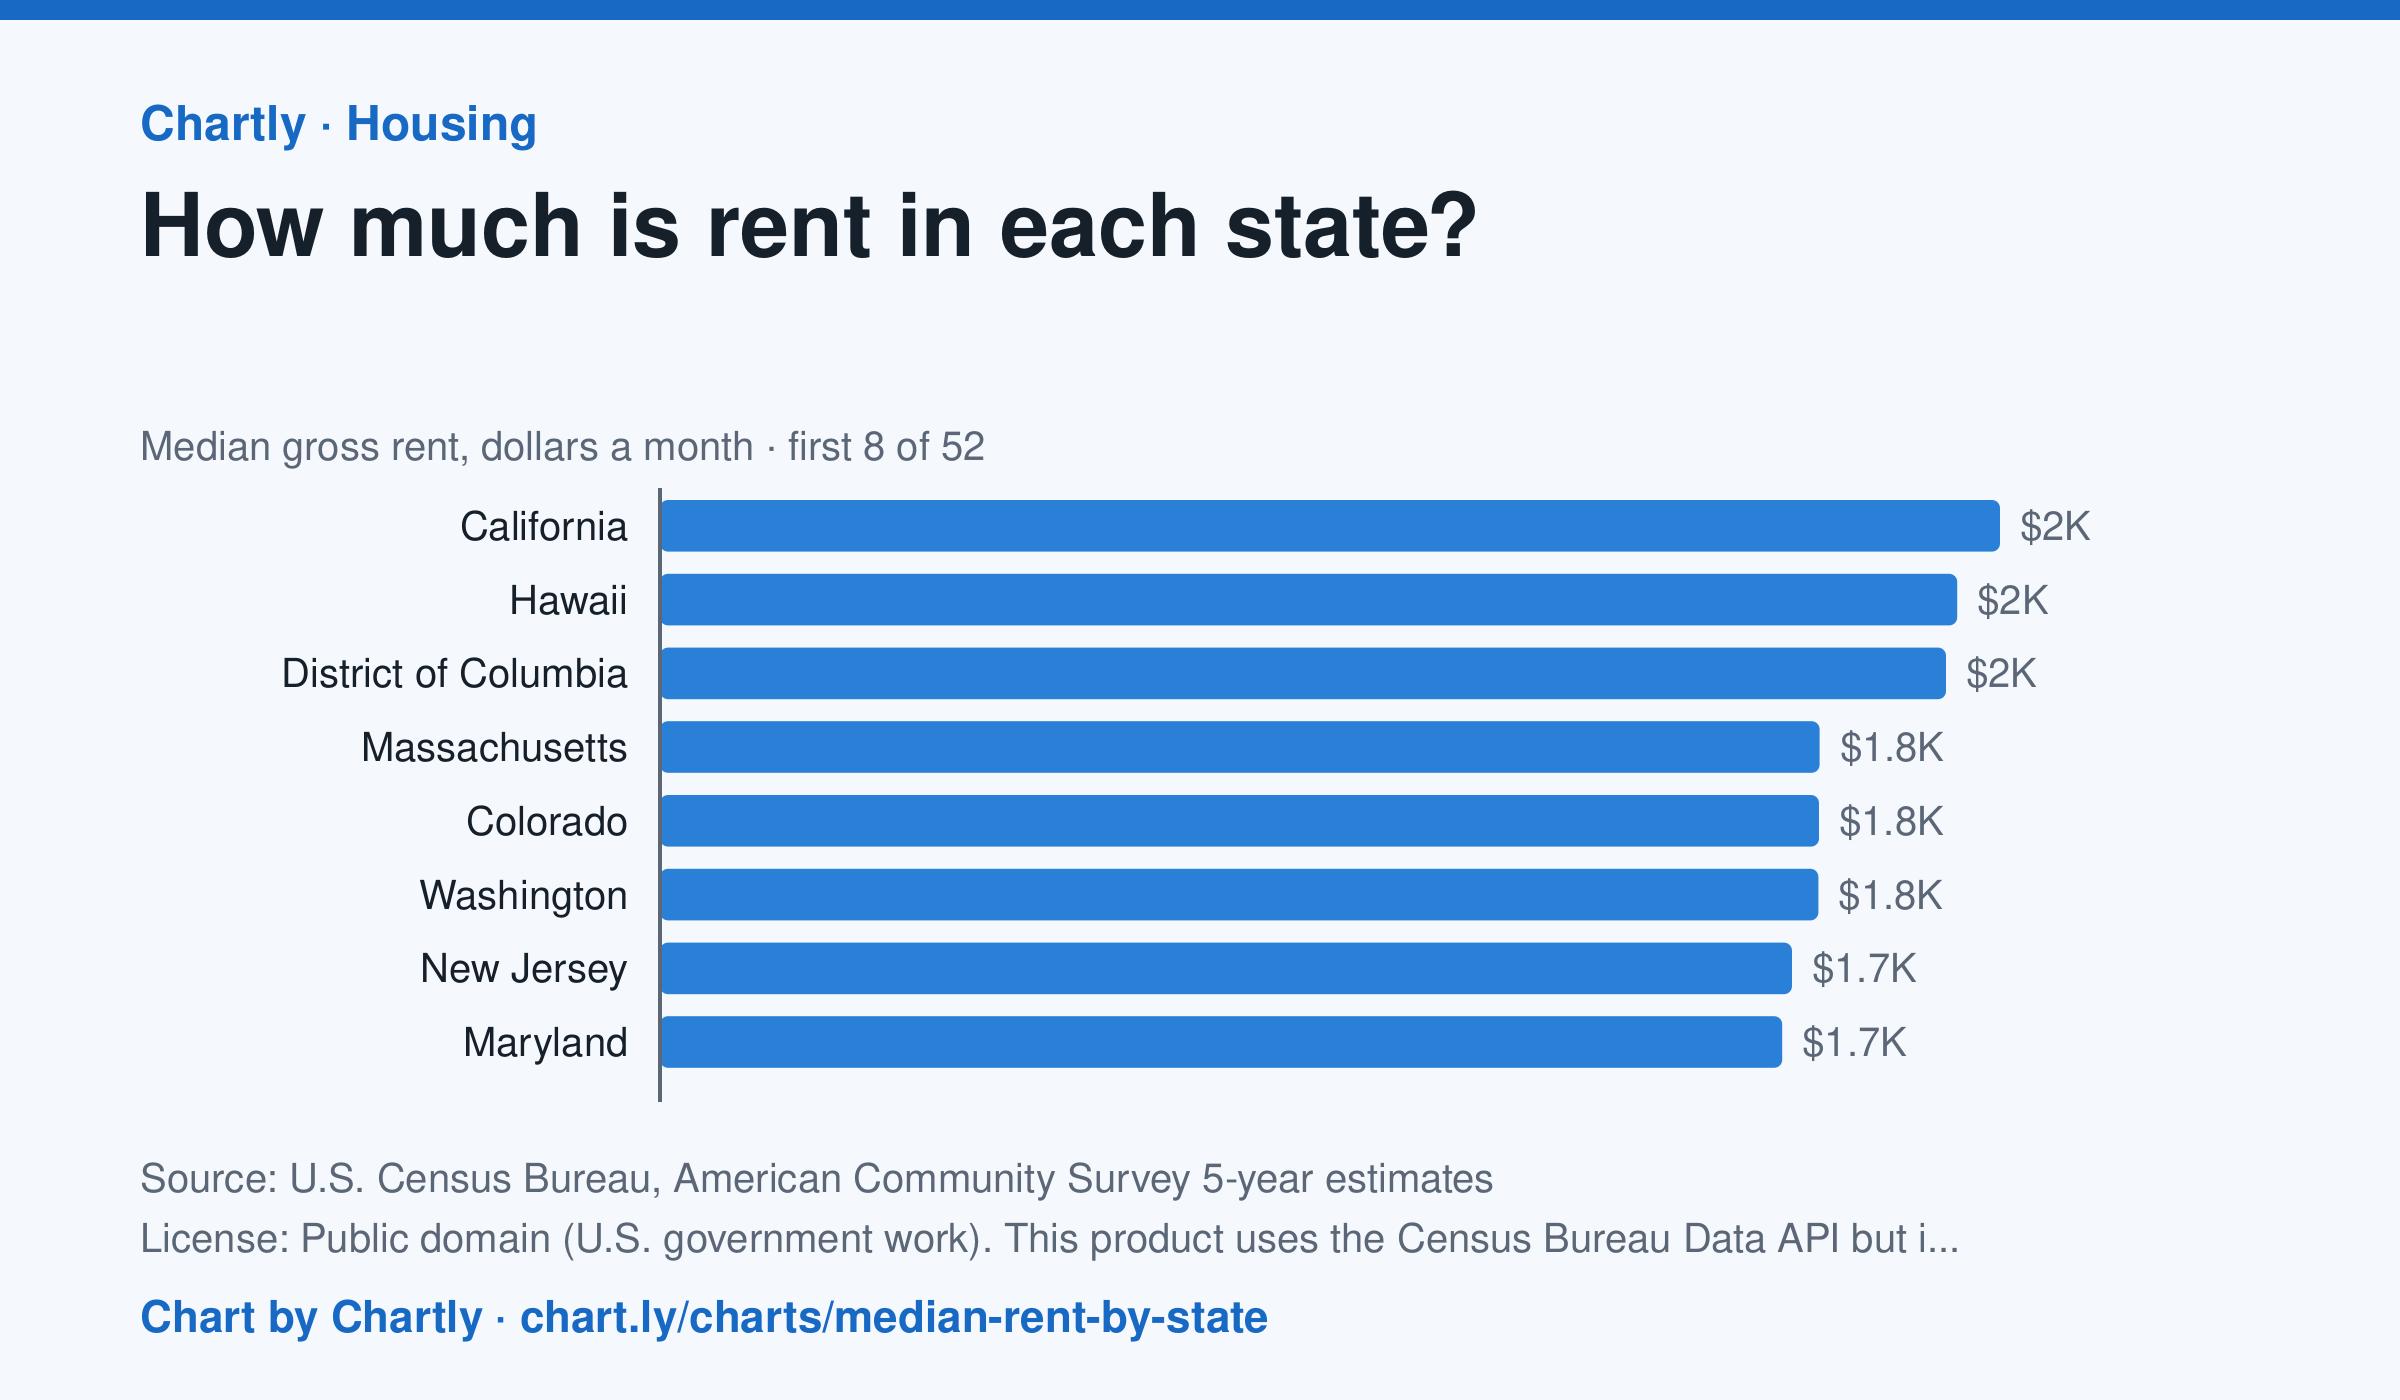
In the Census Bureau's 5-year survey ending in 2024, median rent including utilities was highest in California, $2,036 a month, followed by Hawaii ($1,971) and District of Columbia ($1,954). West Virginia was lowest at $872, and the U.S. median was $1,413. Averaged over five years, these figures trail the latest rent increases.
Source: U.S. Census Bureau, American Community Survey 5-year estimates (Public domain (U.S. government work). This product uses the Census Bureau Data API but is not endorsed or certified by the Census Bureau.) · Data as of Dec 31, 2024
How to read this chart
Each bar is the median monthly rent, including utilities, in a state: half of renters pay more and half pay less. The figures come from a Census survey of a sample of homes, so each has a margin of error, shown as a thin line and a ± figure. The dashed line is the whole U.S.
Questions
- Which state has the highest median rent and which the lowest? How many times more is the highest?
- Why is a median a better way to describe typical rent than an average, when a few apartments cost a huge amount?
- Two states' rents are only a few dollars apart and their margins of error overlap. Can you say which one is really higher?
Chart and numbers: chart.ly/charts/median-rent-by-state · More free charts at chart.ly
Chart 3 of 3 · World
What share of people use the internet in each country?
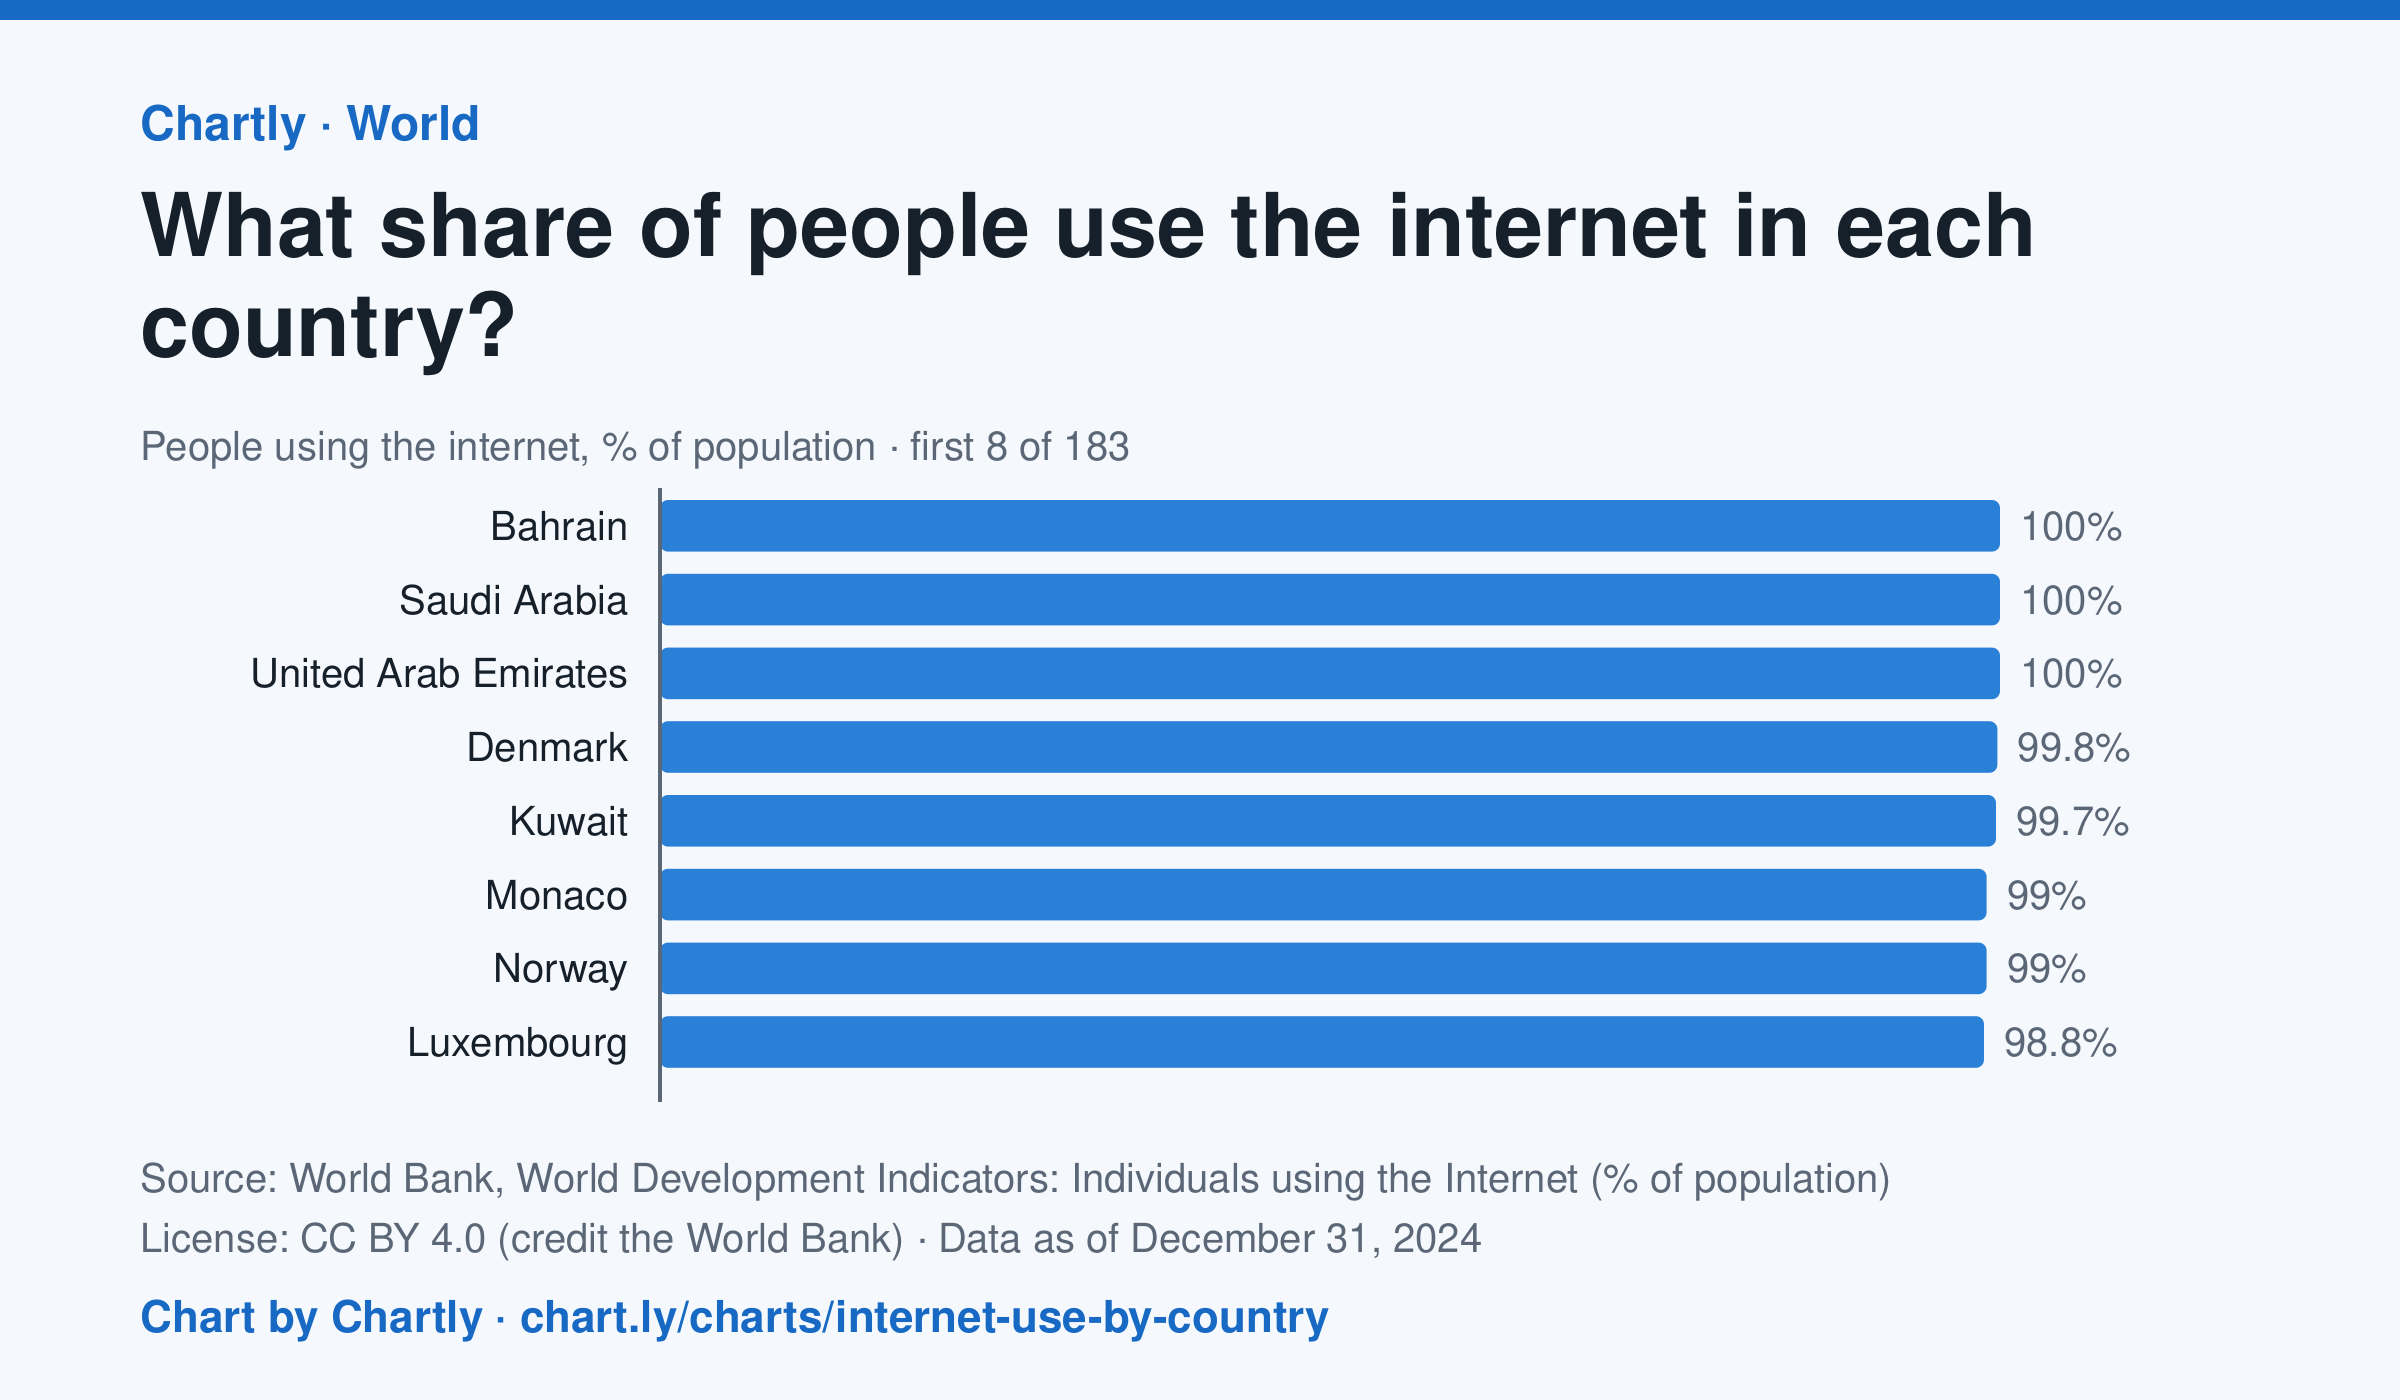
In 2024, 94.7% of people in the United States used the internet and 64.9% in India. The highest share was 100%, and the lowest 8.6%, in Burundi. 182 countries and territories had a 2024 figure. It counts people who used the internet at least once in the previous three months; places without a 2024 figure are left out.
Source: World Bank, World Development Indicators: Individuals using the Internet (% of population) (CC BY 4.0 (credit the World Bank)) · Data as of Dec 31, 2024
How to read this chart
Each bar is the share of a country's people who used the internet in the previous three months. The dashed line is the whole world. The chart opens on the top and bottom of the ranking; search for a country to find its bar among the rest.
Questions
- Find the United States and one country on another continent. How far apart are their shares?
- What do the countries at the bottom of the ranking have in common? What might keep people there offline?
- The world figure is closer to the bottom than many rich countries are to the top. Why might that be?
Chart and numbers: chart.ly/charts/internet-use-by-country · More free charts at chart.ly